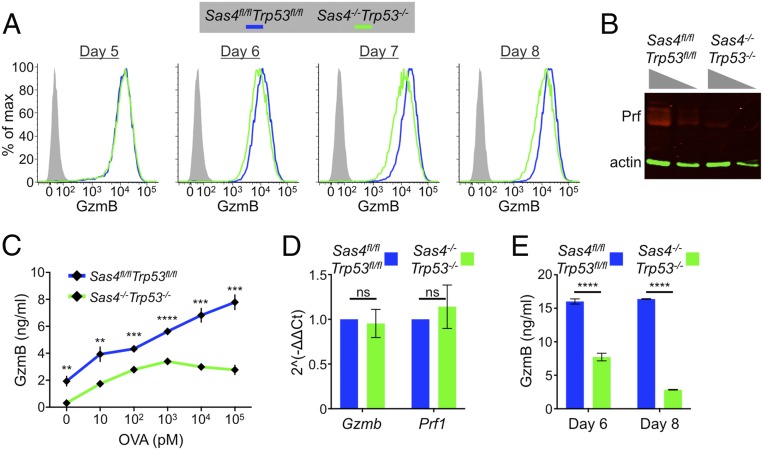
Fig. 4.
Sas4−/−Trp53−/− CTLs carry and secrete less cytotoxic cargo. (A) Sas4fl/flTrp53fl/fl naive OT1 T cells were stimulated with OVA-loaded splenocytes and then transduced with Cre-expressing or control retrovirus after 48 h. Subsequently, GzmB expression levels were assessed by flow cytometry in the differentiating CTLs at the indicated time points. (B) Perforin expression in day 8 Sas4fl/flTrp53fl/fl or Sas4−/−Trp53−/− OT1 CTLs was evaluated by immunoblot using actin as a loading control. Two dilutions of each sample were loaded as indicated by the gray triangles. (C) RMA-s target cells were loaded with increasing concentrations of OVA and mixed with Sas4fl/flTrp53fl/fl or Sas4−/−Trp53−/− OT1 CTLs. GzmB levels in the medium after 6 h were assessed by ELISA. (D) Quantitative RT-PCR analysis of Gzmb and Prf1 mRNA expression in Sas4fl/flTrp53fl/fl or Sas4−/−Trp53−/− OT1 CTLs. (E) GzmB levels in the culture medium of day 6 and day 8 Sas4fl/flTrp53fl/fl and Sas4−/−Trp53−/− OT1 CTLs were quantified by ELISA. In C–E, error bars denote SEM. P values (**, ***, ****, and ns indicate P < 0.05, P < 0.001, P < 0.0001, and not significant, respectively) were calculated by two-tailed Student’s t test in all panels.

