Fig. 5.
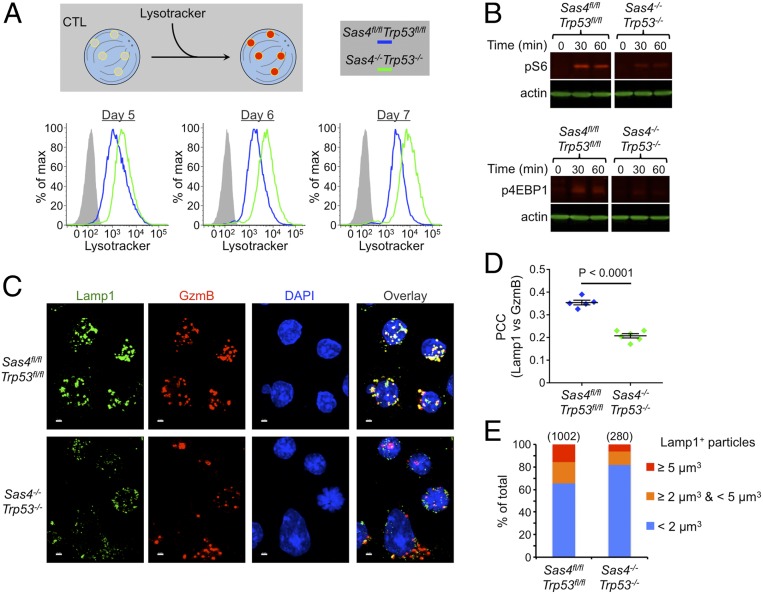
Centriole loss disrupts lytic granule biogenesis. (A) Sas4fl/flTrp53fl/fl naive OT1 T cells were stimulated with OVA-loaded splenocytes and then transduced with Cre-expressing or control retrovirus after 48 h. Subsequently, lysosomal volume was assessed by lysotracker staining at the indicated time points. (B) Serum and nutrient-starved Sas4fl/flTrp53fl/fl and Sas4−/−Trp53−/− OT1 CTLs were incubated in complete medium for the indicated times after which pS6 kinase and p4EBP1 were assessed by immunoblot using actin as a loading control. (C) Representative confocal images of Sas4fl/flTrp53fl/fl and Sas4−/−Trp53−/− OT1 CTLs stained with antibodies against Lamp1 and GzmB proteins. Nuclear DAPI staining is shown in blue. (Scale bars, 2 μm.) (D) PCC between Lamp1 and GzmB fluorescence was determined for each image of Sas4fl/flTrp53fl/fl and Sas4−/−Trp53−/− OT1 CTLs (n ≥ 5). Each image contained 10–20 CTLs. P value was calculated by two-tailed Student’s t test. (E) Graph showing the distribution of Lamp1+ particle size (see Materials and Methods) in Sas4fl/flTrp53fl/fl and Sas4−/−Trp53−/− OT1 CTLs. The number of particles analyzed is indicated in parentheses above each bar.

