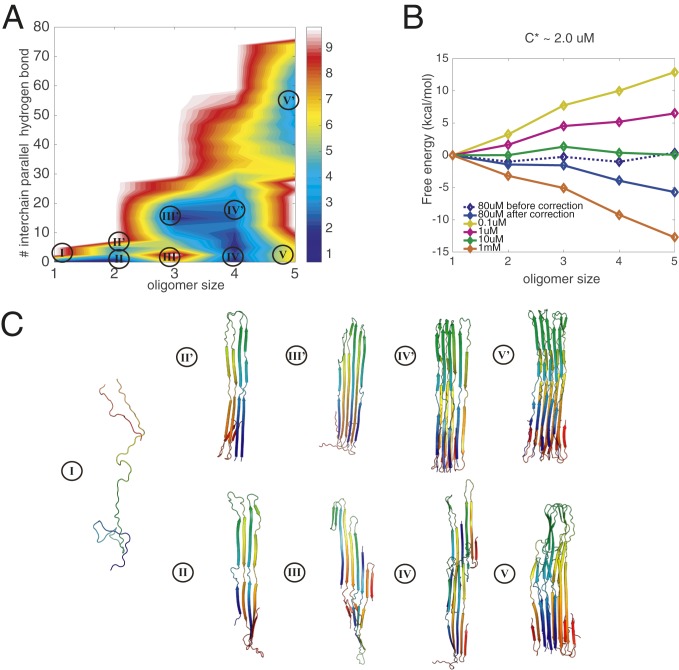
Fig. 2.
Grand canonical free-energy profiles for R1/3/4 at a temperature of 300 K. (A) The 2D free-energy surface at the concentration of 80 M is plotted using the number of intermolecular parallel hydrogen bonds and the oligomer size as the two dimensions. The number of intermolecular parallel hydrogen bonds monitors the association of oligomers into fibrillar -strands. Size is used to label the local basins for different oligomer states. (B) The grand canonical free energy as corrected for concentration changes indicates the saturation concentration of free monomers. Few hexamers were formed in the simulations, so we do not extend the landscapes to the hexamer in the diagram owing to the resulting noise in the free-energy estimation. (C) Representative structures are shown in each basin: Each monomer is colored with a rainbow spectrum from red to blue, N terminus to C terminus. The monomeric state of tau is largely extended and disordered.

