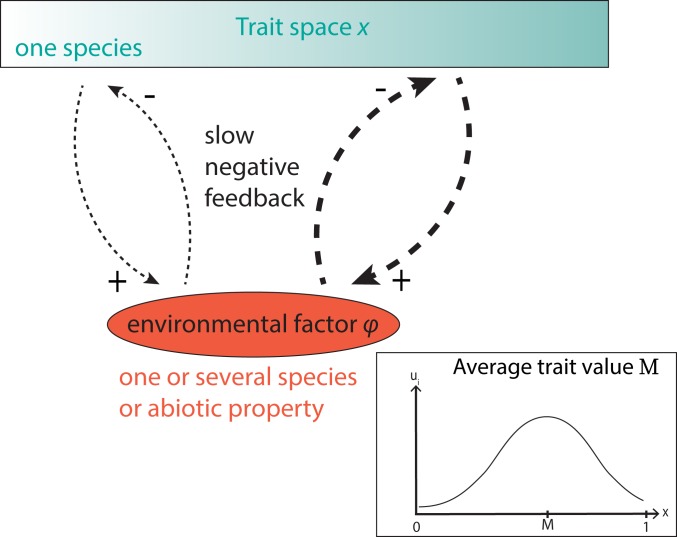
Fig. 2.
A single evolving trait with a range of possible trait values. One species has a single evolving trait, with a phenotype ranging from to . Dashed lines indicate the negative feedback, which originates from the interaction with the environment (which can be a species, an abiotic factor, or a property of the ecosystem). Thicker lines denote a stronger interaction with the environment, and therefore a stronger negative feedback. Inset illustrates that is calculated by taking the average trait value in the population, thus weighing the trait values by the density of that phenotype (Eq. 2).

