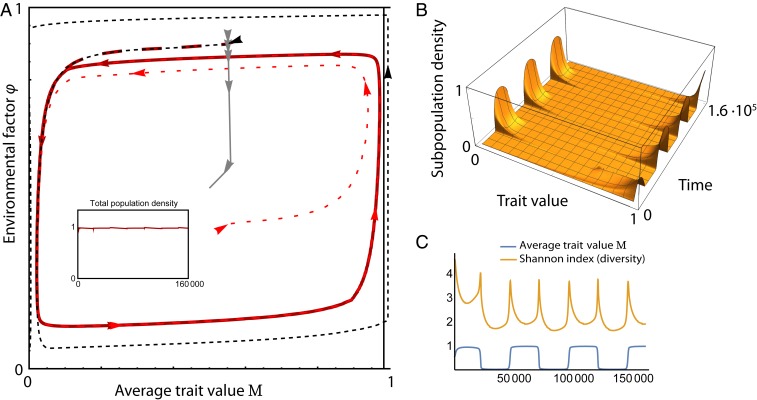
Fig. 3.
Example of evolutionary dynamics with a single evolving trait: behavior of a system following the outline of Fig. 2. (A) System behavior for no mutation (thin dashed lines, resulting in the extinction of the population), fast evolution (gray dashed line, leading to an equilibrium), and slow evolution (dashed red lines; continual evolutionary dynamics from different initial values). Inset shows that the total population remains approximately constant. (B) Phenotype abundances obtained in the continual evolution case. (C) Mean trait value and Shannon diversity index for the same case, showing the emerging fluctuations. Simulation is of 100 phenotypes equally distributed over the range of trait values; see SI Appendix, section S2 for the exact equations and parameter values.

