Fig. 2.
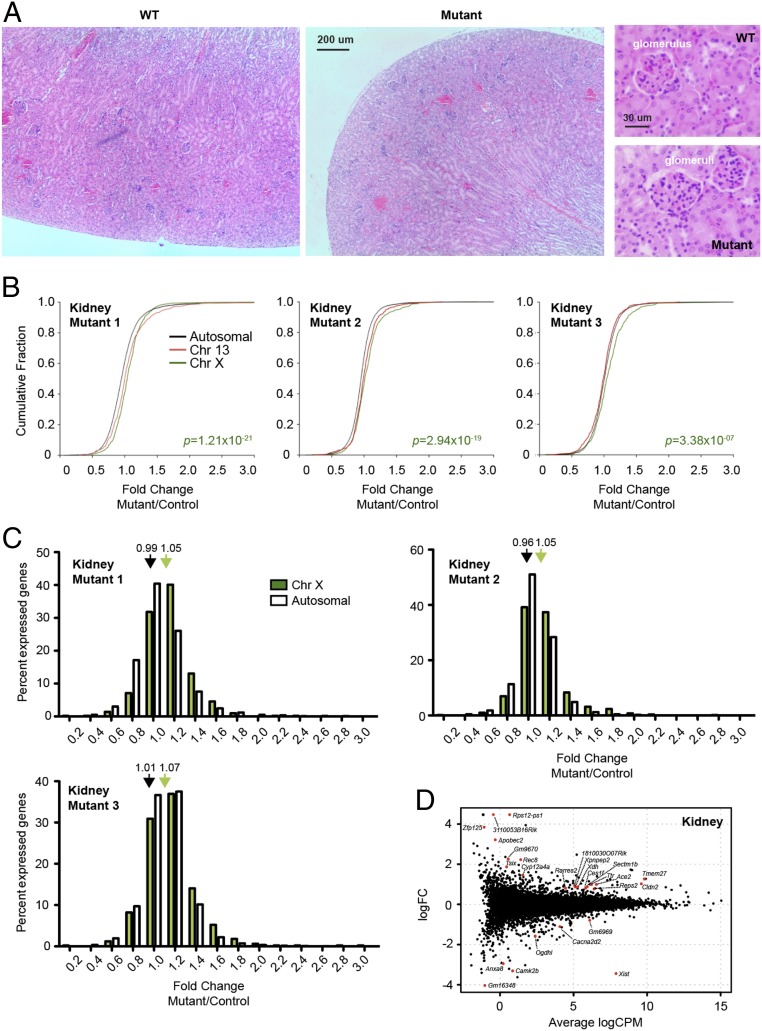
Xist-deleted organ of Meox2-Cre females show mild X–autosome dosage imbalance. (A) H&E stain of wild-type and mutant kidneys at 40× and 400×. (B) Cumulative distribution plot for fold changes of genes on chromosome 13 (red), chromosome X (green), and all autosomes (black). Three biological replicates (three female mutants; three controls) are shown. P value, Wilcoxon’s rank sum test. (C) Distribution of X-linked (green) vs. autosomal (white) fold changes in three Xist-null kidneys relative to three controls. Average fold changes of X-linked or autosomal genes are indicated. **P < 0.01; ***P < 10−8, Fisher’s exact test. Data represent mean ± SEM. (D) Genome-wide differential expression in the kidney of WT vs. Xist-mutant females. Log fold change in mutant vs. WT shown. Differentially expressed genes (FDR < 0.05) are in red.

