Fig. 3.
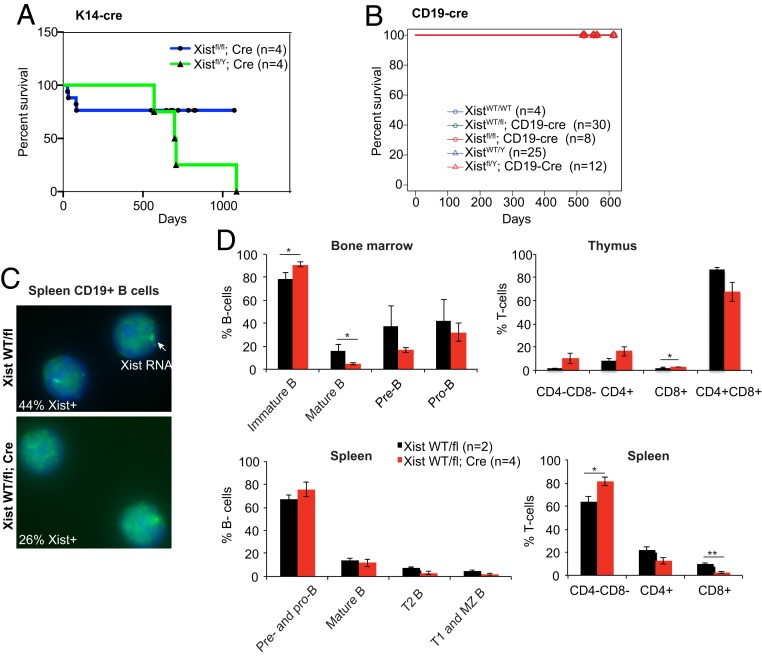
No evident morbidity and mortality in female mice conditionally deleted for Xist in epithelial (K14-Cre) and B cell (CD19-Cre) lineages. (A) Kaplan–Meier kill curves plotted over 1,000 d for K14-cre animals. There were no significance differences between Xistfl/fl; K14-cre or Xistfl/Y; K14-cre males. (B) Kaplan–Meier kill curves plotted over 600 d for CD19-cre animals. There were no differences between control groups and XistWT/fl; CD19-cre or Xistfl/fl; CD19-cre females, or Xistfl/Y; CD19-cre males. Control groups contained XistWT/fl, XistWT/WT, CD19-cre, Xist Xist+/+ females and Xistfl/Y, Xist+/Y, and Xist+/Y; CD19-cre males. All curves are superimposed at 100% survival. (C) Representative Xist RNA-FISH for spleen B cells from XistWT/fl vs. XistWT/fl; CD19-cre females. (D) FACS analyses of B and T cell percentages in bone marrow, thymus, and spleen of XistWT/fl vs. XistWT/fl ; CD19-cre females. See also FACS data in SI Appendix, Fig. S4. B cells in bone marrow were categorized based on expression of B220, IgM, and CD43; Immature B cells (B220−, IgM−), mature B cells (B220+, IgM+), pre-B cells (B220+, IgM−, CD43−), pro-B cells (B220+, IgM−, CD43+). B cells in spleen were categorized based on expression of IgM and IgD; pre- and pro-B cells (IgM−, IgD−), mature B cells (IgDhigh, IgMlow), T2 B cells (IgDhigh, IgMhigh), and T1 and marginal zone (MZ) B cells (IgD−, IgMhigh). T cells were categorized based on expression of CD4 and CD8. Percentage of cells are means ± SEM. Significance is calculated using t test. *P < 0.05; **P < 0.01.

