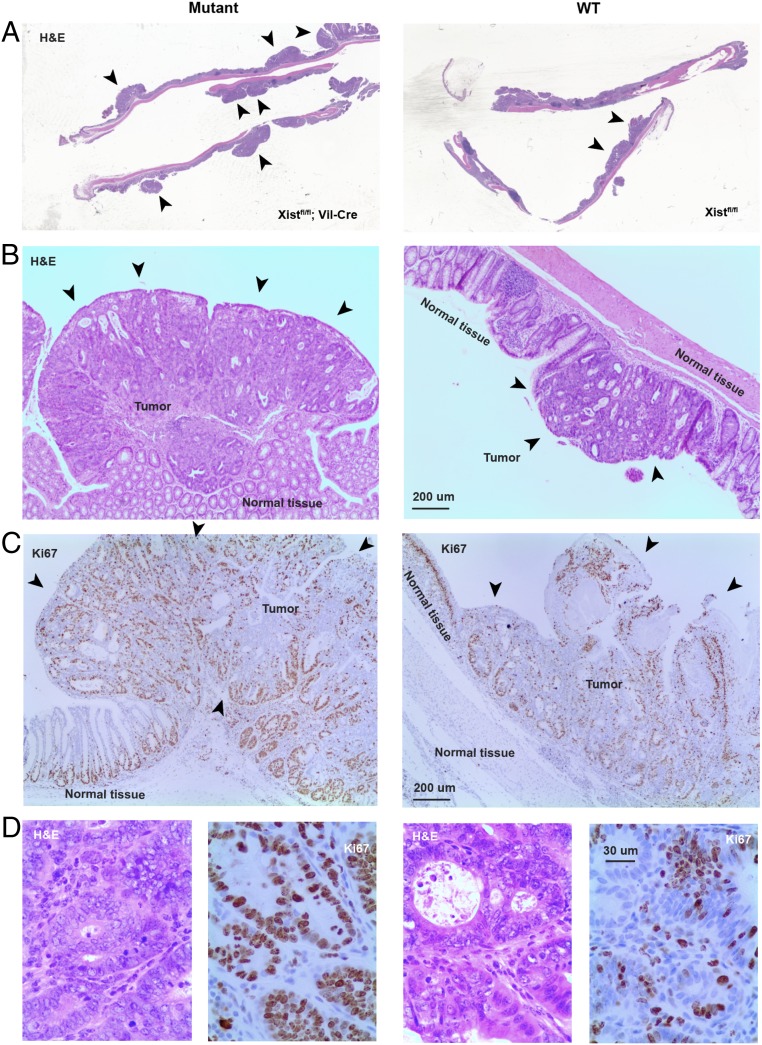
Fig. 5.
Histologic analysis of mutant and control guts following AOM/DSS induction. (A) H&E staining of distal half of colon. The arrowheads point to polyps. Note larger and more polyps in the Xist-null mice relative to control Xist-positive littermates. (B) The 40× magnifications of a single polyp/tumor in mutant vs. control mice. H&E stained. (C) The 40× magnification of immunohistochemical staining for the cell proliferation marker, Ki67 (brown), in mutant and control gut sections. Note that normal tissue shows organized cell proliferation at the base of the crypts only. In tumors, the tissue is disorganized and proliferation is seen throughout the tumor mass. (D) H&E (Left) and Ki67 staining (Right) of mutant and control polyps at 100× magnification.

