Fig. 6.
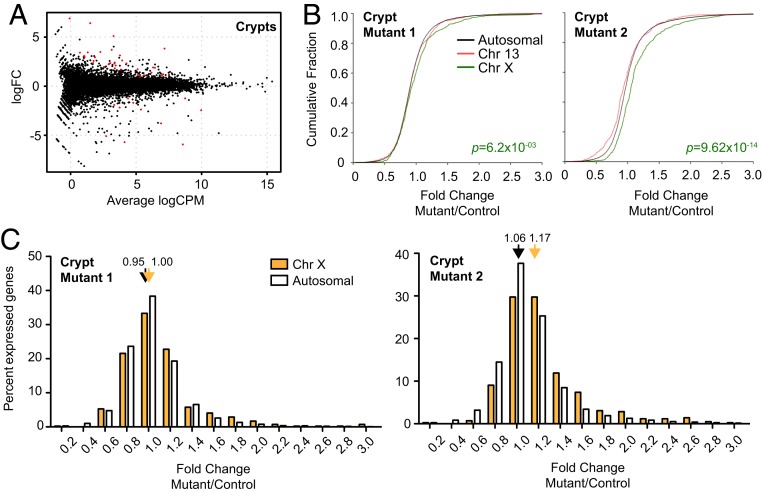
Transcriptomic analysis of healthy crypts in Xist-deleted and control gut epithelium. (A) Genome-wide differential expression for healthy crypts surrounding polyps. Log2 fold change shown for mutant vs. wild-type crypts. Differentially expressed genes (FDR < 0.05) are in red. (B) CFPs for fold changes of genes on chromosome 13 (red), chromosome X (green), and all autosomes (black). Two biological replicates shown (two pairs of mutant and control females). P value, Wilcoxon’s rank sum test. (C) Distribution of X-linked (blue, polyps; cyan, crypts) vs. autosomal (white) fold changes in Xist-null polyps/crypts relative to corresponding controls. Two biological replicates shown (two pairs of mutant and control females). Average fold changes of X-linked or autosomal genes are indicated. *P < 0.05; **P < 0.01; ***P < 10−8, Fisher’s exact test. Data represent mean ± SEM; n = 2 (crypts), n = 4 (polyps).

