Fig. 2.
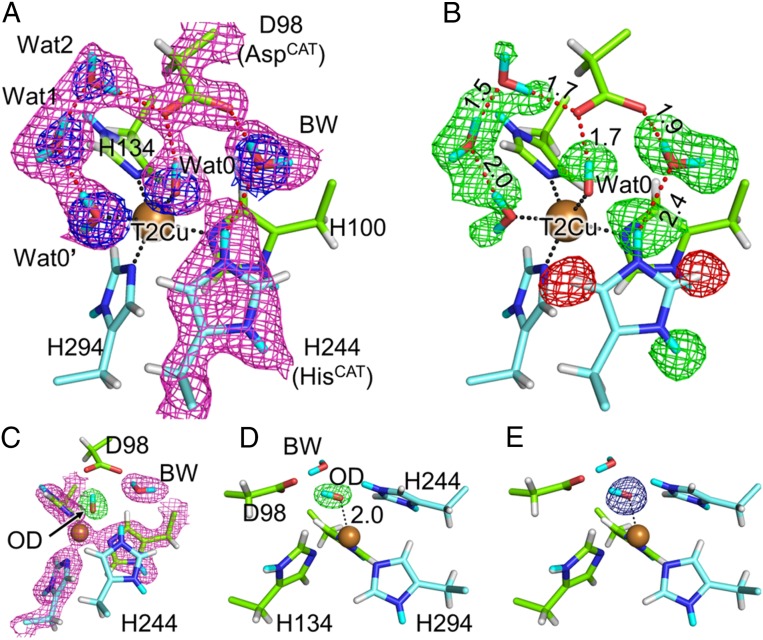
Protonation state of the T2Cu site. (A) Sigma-A–weighted 2Fo–Fc maps for X-ray (blue, contoured at 1.5 σ) and neutron (magenta, contoured at 1.0 σ) data. (B) Positions of H and D atoms. Sigma-A–weighted Fo–Fc neutron maps are shown by green (+3.0 σ) and red (−3.0 σ) meshes. Hydrogen bonds are illustrated by dashed red lines, and their distances are shown in ångströms. Dashed black lines indicate coordination bonds. H and D atoms are colored by white and cyan, respectively. Na, Cl, and Cu4 atoms are eliminated for the clarity. (C) Sigma-A–weighted 2Fo–Fc neutron (magenta, contoured at 1.5 σ) and Fo–Fc OD-omit neutron (green, contoured at +6.0 σ) maps. (D) The side view of C. The coordination bond between OD and T2Cu (dashed black line) is shown in Å unit. (E) Sigma-A–weighted Fo–Fc OD-omit electron density map contoured at +6.0 σ, which is viewed from the same direction as D.

