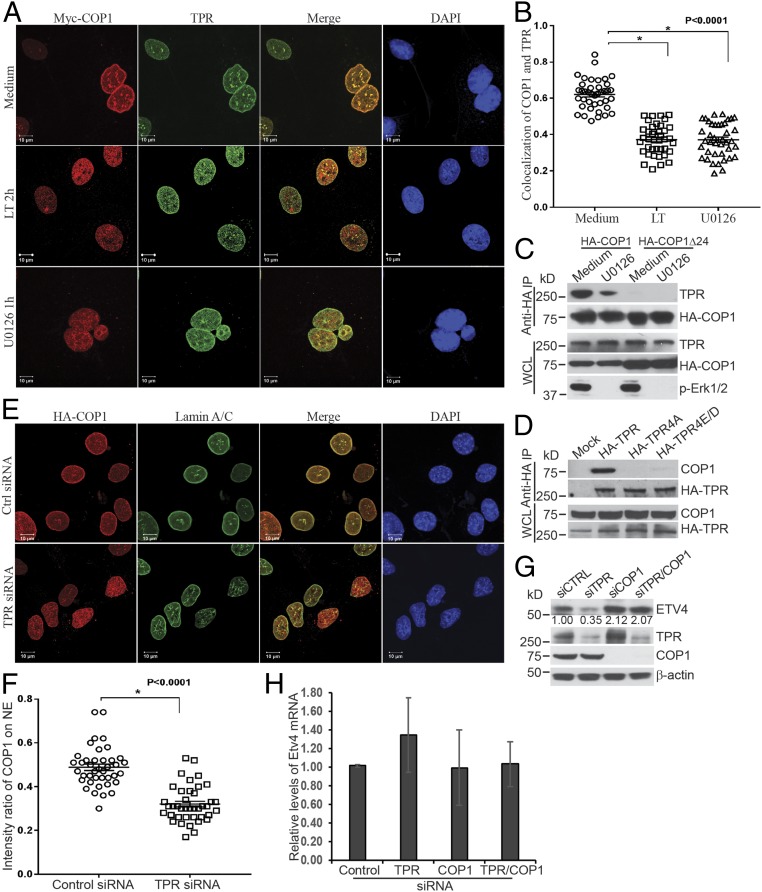
Fig. 4.
COP1 attaches to the nuclear envelope via binding to the nucleoporin, TPR. (A) Hepa1c1c7 cells stably expressing Myc-COP1 were cultured with or without LT for 2 h or U0126 for 1 h. The cells were then analyzed by immunofluorescence staining with mouse anti-Myc and rabbit anti-TPR primary antibodies followed by goat anti-mouse IgG-Alexa Fluor 568 and goat anti-mouse IgG-Alexa Fluor 633 secondary antibodies. The location of Myc-COP1, TPR, and the nucleus was assessed by a LSM 880 confocal microscope. (B) Analyses of fluorescence intensity and colocalization of COP1 and TPR were performed using Bitplane Imaris image analysis software. Pearson’s colocalization coefficient was calculated from 40 nuclei, from 9 to 13 randomly selected image files obtained from two or three independently performed experiments. Data were statistically analyzed using an unpaired, two-tailed t test at the 95% confidence interval using GraphPad Prism software and presented as means ± SE. *P < 0.0001. (C) Hepa1c1c7 cells stably expressing HA-COP1 or HA-COP1Δ24 were cultured with or without U0126 for 1 h, and then extracted with xTractor lysis buffer containing protease inhibitors. The cell lysates were then immunoprecipitated with anti-HA magnetic beads. The levels of TPR and HA-COP1 proteins in the immunoprecipitated complex and whole cell lysates (WCLs) were analyzed by Western blotting. (D) 293T cells were transfected with mock, HA-TPR, HA-TPR4A, and HA-TPR4E/D vectors. Two days following the transfection, the cells were extracted with xTractor lysis buffer containing protease inhibitors. The cell lysates were used for immunoprecipitation with anti-HA magnetic beads. The levels of HA-TPR and endogenous COP1 proteins in immunoprecipitated complex and WCLs were analyzed by Western blotting. (E) Hepa1c1c7 cells stably expressing HA-COP1 were transfected with control or TPR siRNA. Two days following transfection, the cells were analyzed by immunofluorescence staining with mouse anti-Lamin A/C and rabbit anti-HA primary antibodies followed by goat anti-mouse IgG-Alexa Fluor 633 and goat anti-rabbit IgG-Alexa Fluor 568 secondary antibodies. The locations of Lamin A/C, HA-COP1, and the nucleus were assessed by LSM 880 confocal microscope. (F) Fluorescence intensities were quantified using the Bitplane Imaris image analysis software. The intensity ratios of COP1 located on the NE to that in the nucleoplasm were calculated using data from 40 nuclei, 9 to 13 randomly selected image files obtained from two or three independently performed experiments. Data were statistically analyzed using an unpaired, two-tailed t test at the 95% confidence interval using GraphPad Prism software and presented as means ± SE. *P < 0.0001. (G and H) Hepa1c1c7 cells were transfected with control or TPR siRNA. Two days after the transfection, the cells were extracted with NuPAGE LDS sample buffer (G) or TRIzol (H). The levels of ETV4 protein (G) and mRNA (H) were measured by Western blotting (G) and quantitative PCR (H). β-Actin levels were used as loading controls. Data shown are representative of three independent experiments (G) or mean ± SE from three independent experiments (H). Intensities of Western blotting bands were quantified, normalized using β-actin levels, and are shown under each band (G).

