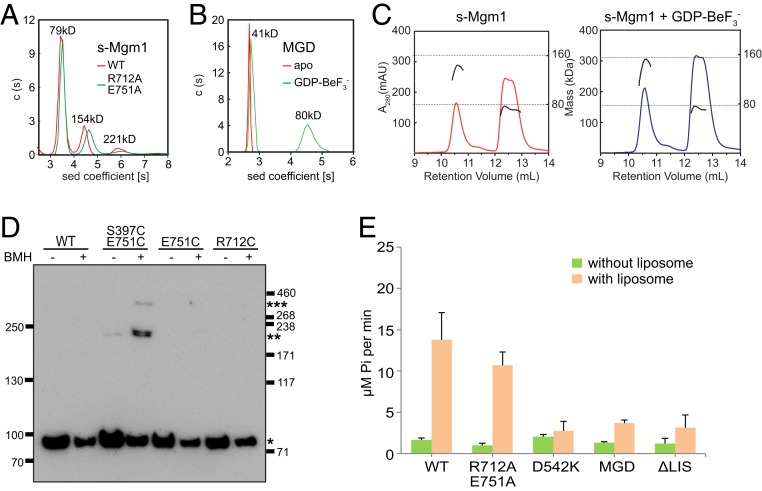
Fig. 4.
Oligomerization of s-Mgm1. (A) The size of s-Mgm1 (theoretical molecular mass 80.0 kDa), both WT and R712A/E751A mutant, was determined at 25 μM by AUC in a buffer containing 500 mM KCl. The estimated molecular masses are given above the peaks (in kilodaltons, kDa). The data are representative of at least three repetitions. (B) As in A, but with Mgm1-MGD (theoretical molecular mass 43.2 kDa) in the absence or presence of 0.5 mM GDP and 2.5 mM BeF3− in a buffer containing 500 mM KCl. (C) The size of s-Mgm1 (theoretical molecular mass 80.0 kDa) was determined by MALS coupled with gel filtration in the absence or presence of 0.5 mM GDP and 2.5 mM BeF3− in a buffer containing 500 mM KCl. The estimated molecular masses are shown by the right axis. The data are representative of at least three repetitions. (D) Purified HA-tagged Mgm1 (0.6 μM), WT, or indicated mutant was treated by 5 μM BMH at room temperature for 20 min. Samples were quenched and analyzed by SDS/PAGE and immunoblotting (IB) with anti-HA antibodies. Different oligomeric states are indicated by asterisks (*). Molecular markers are shown at the side (in kilodaltons). The data are representative of at least three repetitions. (E) The GTPase activity of various Mgm1 constructs was measured in the absence or presence of liposomes (1 mM, POPC:POPE:CL:PI:DOPS:Rhodamine-PE = 39:28.5:20:8:4:1.5) in a buffer with 100 mM KCl and 5 mM MgCl2. A total of 1 μM protein was used for each sample. GTP hydrolysis was measured by phosphate release at saturating GTP concentrations (0.5 mM). Data are presented as the mean ± SD of nine measurements from three independent experiments.

