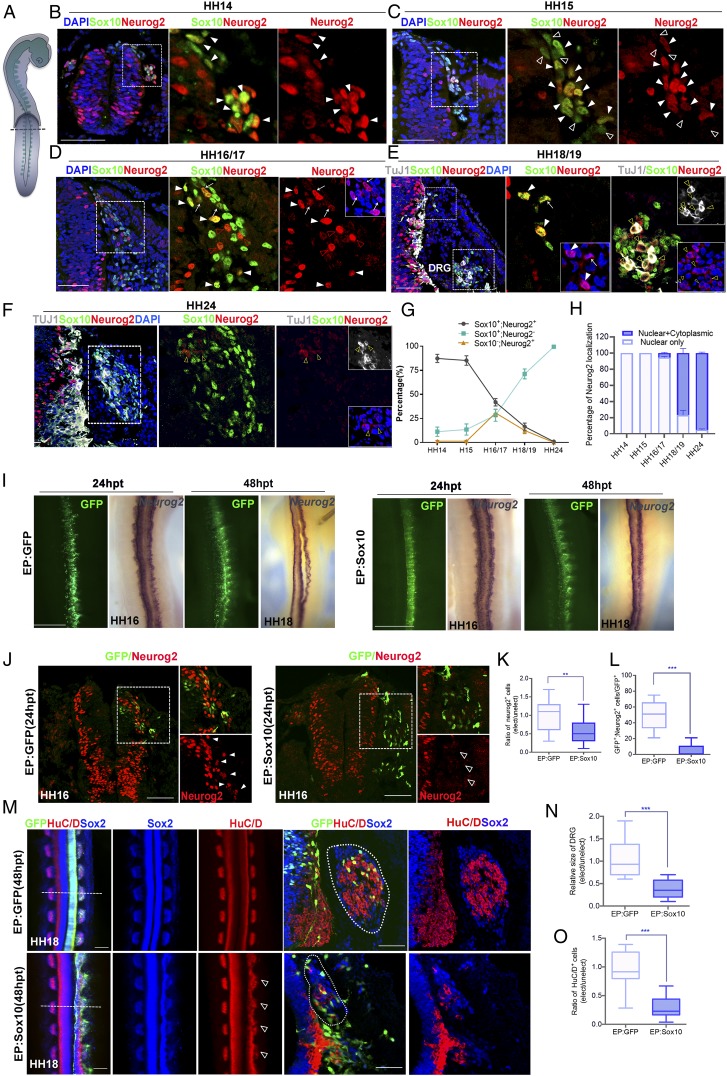
Fig. 1.
Overexpression of Sox10 negatively regulates Neurog2 protein expression. Immunofluorescence for Sox10 and Neurog2 in the transverse sections of the trunk neural tube (A) from chicken embryos at (B) HH14, (C) HH15, (D) HH16/17, (E) HH18/19, and (F) HH24. The magnified areas are marked with dashed boxes. (B–E) Solid white arrowheads indicate Sox10+Neurog2+ (nuclear) cells. (C) Open arrowheads indicate cells expressing Sox10 alone. (D and E) White arrows indicate Sox10+Neurog2+ (nuclear+cytoplasmic). (D) Red open arrowheads indicate cells expressing Neurog2 (nuclear) alone. (E and F) TuJ1 was detected in the dorsal root ganglia (DRG) on HH18/19 and HH24. Yellow open arrowheads indicate cells expressing both Neurog2 (nuclear+cytoplasmic) and TuJ1 together. (G) Graph showing the percentage of cells expressing Sox10 or Neurog2 alone and both proteins in the total number of cells positive for the indicated markers at the indicated stages. Average number of cells counted from at least 15 sections from 3 embryos per stage. (H) Graph showing the percentage of cells with nuclear Neurog2 or nuclear+cytoplasmic Neurog2 in the total number of Neurog2+ cells. (I) In situ hybridization for Neurog2 on embryos electroporated (EP) with GFP vector control (n = 5) or Sox10 (n = 5) at 24 and 48 hpt. (J) Immunofluorescence for Neurog2 on transverse sections of embryos electroporated with the indicated constructs. The magnified areas are marked with dashed boxes. Solid white arrowheads indicate endogenous Neurog2 expression, and open arrowheads indicate loss of Neurog2 expression. (K) Graph showing ratio of Neurog2+ cells between the electroporated and unelectroporated sides of embryos treated with the indicated constructs. (L) Quantification of the number of Neurog2+ cells in embryos transfected with the indicated constructs. (M) Immunofluorescence for HuC/D and Sox2 in embryos electroporated with GFP (n = 6) or Sox10 (n = 7). Dotted lines indicate plane of sectioning. Open arrowheads indicate DRG dysplasia. The border of the DRG is marked by dotted lines. (N) Graph showing fold differences in the size of the DRG between the electroporated and unelectroporated sides of embryos treated with the indicated constructs. (O) Graph showing ratio of HuC/D+ cells between the electroporated and unelectroporated sides of embryos treated with the indicated constructs. Error bars ± SEM (**P < 0.01, ***P < 0.001). (Scale bars: embryos, 20 μm; sections, 50 μm.)

