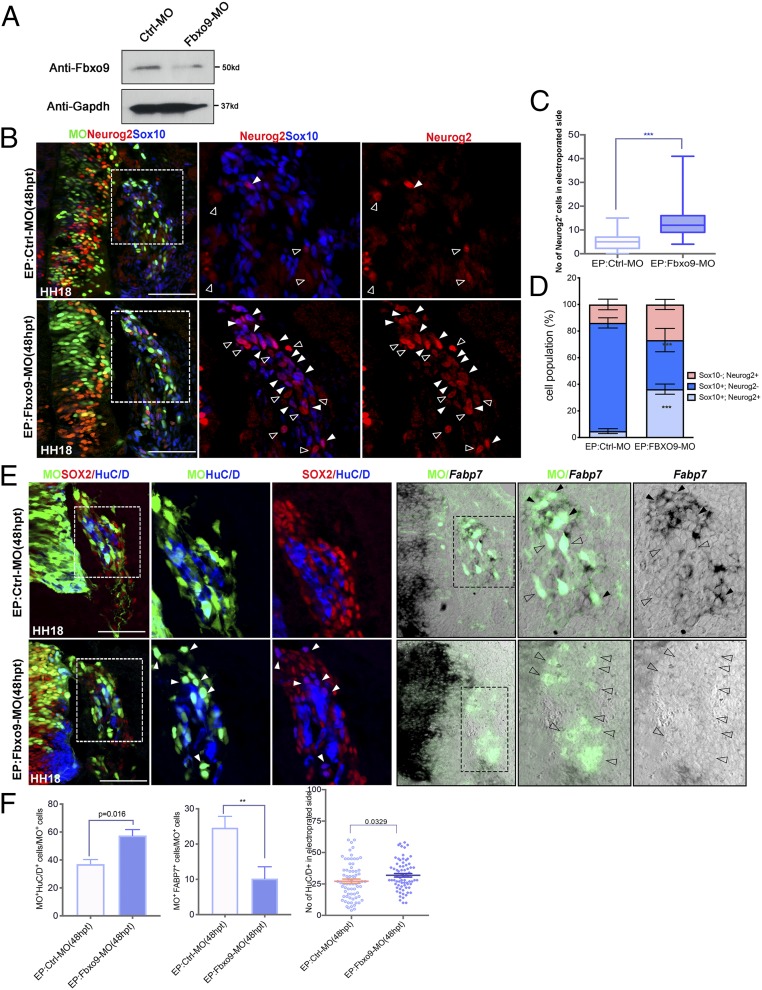
Fig. 5.
Fbxo9 knockdown leads to persistent Neurog2 protein expression and inhibits glial differentiation. (A) Lysates from chicken embryos treated with Ctrl-MO (n = 10) and Fbxo9 MO (n = 10) at 24 hpt were subjected to Western blotting for Fbxo9. GAPDH served as a loading control. (B) Immunofluorescence for Neurog2 and Sox10 on cross-sections of embryos treated with Ctrl-MO (n = 8) and Fbxo9 MO (n = 8) at 48 hpt. Solid white and open arrowheads indicate cells expressing both Sox10/Neurog2 and Neurog2 alone, respectively. The magnified areas are marked with dashed boxes. (C) Quantification of Neurog2+ cells in the electroporated side of embryos treated with the indicated constructs. (D) Quantification of the number of cells expressing Neurog2 alone, Sox10 alone, and both together in embryos treated with the indicted constructs. (E) Immunofluorescence for Sox2 and HuC/D on cross-sections of embryos electroporated with the indicated constructs at 48 hpt. White arrowheads indicate cells expressing both Sox2 and HuC/D. Adjacent sections were subjected to in situ hybridization for Fabp7 followed by V5 immunofluorescence to mark the MO transfected cells. Black arrowheads indicate cells coexpressing MO and Fabp7, and open arrowheads indicate cells expressing MO alone in the DRG. (F) Quantification of the number of MO+HuC/D+ or MO+Fabp7+ cells in embryos treated with the indicated constructs. Quantification of the number of HuC/D+ cells in the electroporated side of embryos treated with the indicated constructs. Error bars ± SEM (**P < 0.01, ***P < 0.001). (Scale bars, 50 μm.)

