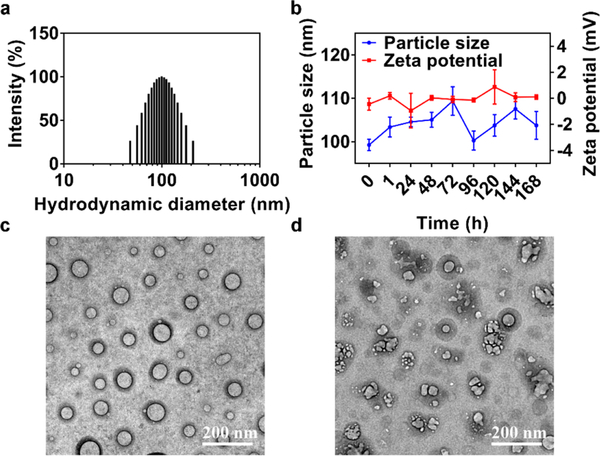
Figure 2.
PEGylated Pt(IV) 6 delivery platform exhibition of redox-triggered degradation. (a) Histogram of particle-size distribution of P6 NPs obtained by DLS. (b) Particle-size and ζ-potential changes of P6 NPs monitored over the course of 1 week. (c, d) TEM morphologies of P6 NPs stored in (c) water or (d) 10 mM DTT at 25 °C for 24 h.

