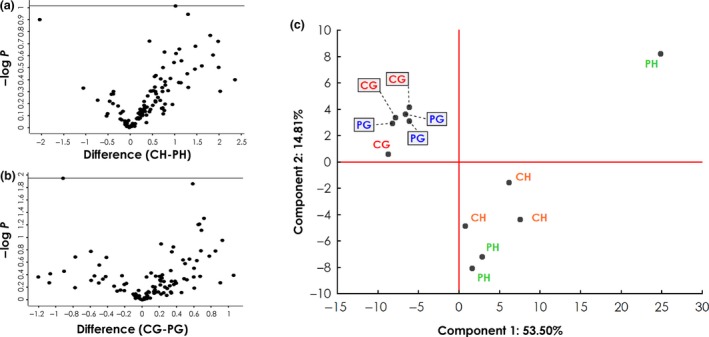
Figure 3.

Analysis of autoantigen abundance in different experiment groups (IDs: PH, CH, PG, CG). Detailed information about the experimental groups can be found in Table 2. (a, b) Volcano plots showing negative log10‐transformed P‐values (t‐test with permutation‐based FDR to correct for multiple testing; y‐axis) against the differences of the means (log2; x‐axis) of two groups. (a) Comparison of antigens from healthy TM cell lysates captured by antibodies from control (CH; n = 3) and POAG sera (PH; n = 3). (b) Comparison of antigens from glaucomatous TM cell lysates captured by antibodies from control (CG; n = 3) and POAG sera (PG; n = 3). (c) Principal component analysis, including all four experiment groups, reveals that most of the variance between the groups can be attributed to the cell line used rather than the antibody source.
