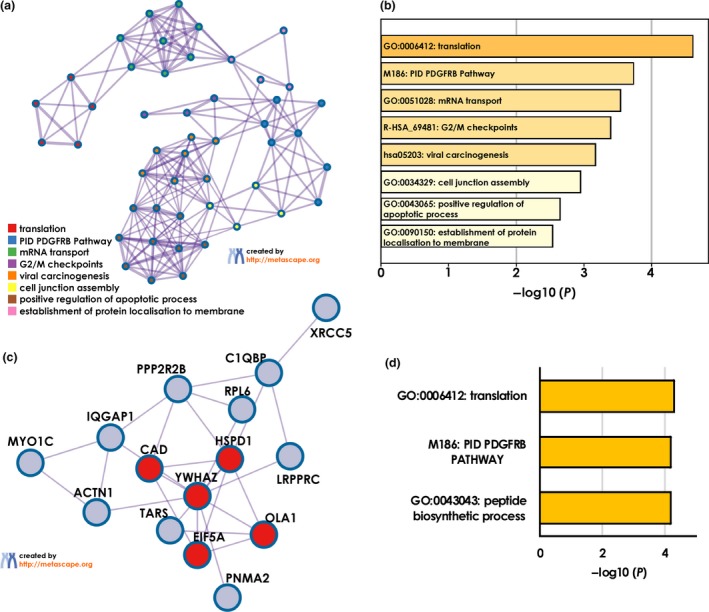
Figure 6.

Metascape analysis of POAG‐related autoantigens. (a) Network of enriched GO and KEGG terms coloured by cluster. (b) Enriched GO and KEGG terms from (a) with corresponding P‐values. (c) Protein–protein interaction network with densely connected components (red) identified by the MCODE algorithm. (d) Enrichment analysis for MCODE cluster only.
