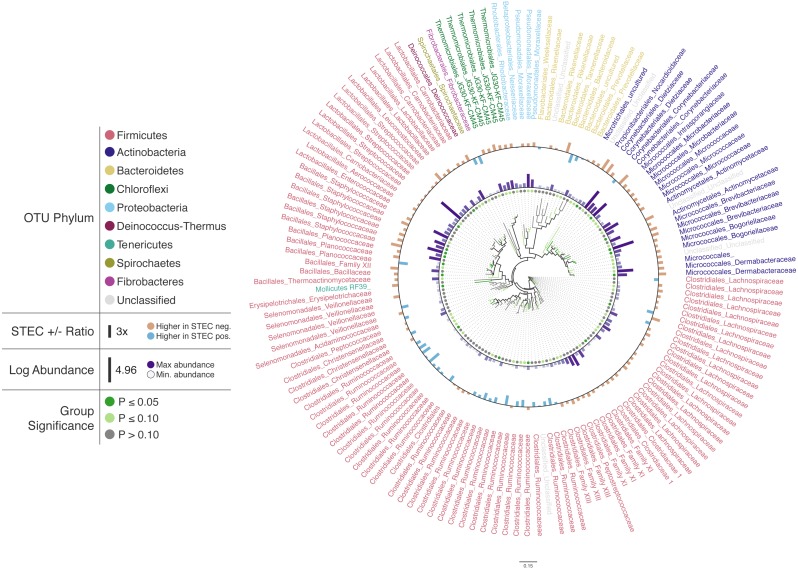
Figure 2. Changes in OTU abundance in two sample groups.
Approximate-maximum likelihood tree of cattle hide SSU rRNA OTUs that showed differences in relative abundance between STEC-positive and STEC-negative samples. Branch and leaf dot coloring represents the p-value of a Mann–Whitney U test (dark green: p ≤ 0.05, light green: 0.05 < p ≤ 0.1, gray: p > 0.1) for changes in OTU abundance between STEC-positive samples and STEC-negative samples. Inner bar heights represent log transformed OTU abundance, and outer bars represent the abundance ratio between STEC positive and STEC negative samples (blue bars for higher abundance in STEC positive samples and brown bars for OTUs with higher abundance in STEC negative samples). Taxa labels show the predicted order and family of the OTU and are colored by the predicted phylum using the Paul Tol Muted color palette included with Iroki.

