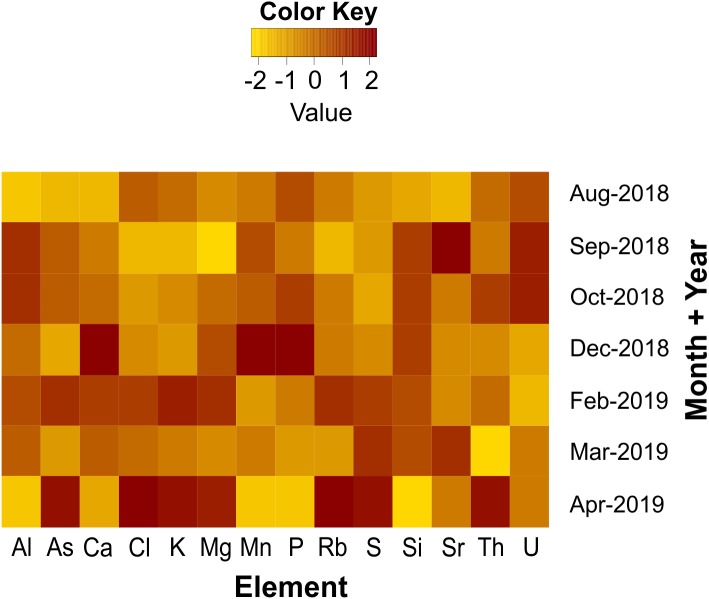
Figure 3. Temporal variability in element concentrations.
Variability in concentration of fourteen different elements (ppm DW) in sargasso collected at Puerto Morelos between August 2018 and April 2019. Z-score transformations were applied to values of each element across all the sampling periods and their intensities above and below the mean are represented on the heatmap by red and yellow colors, respectively, as shown on the color key bar.

