FIG. 2.
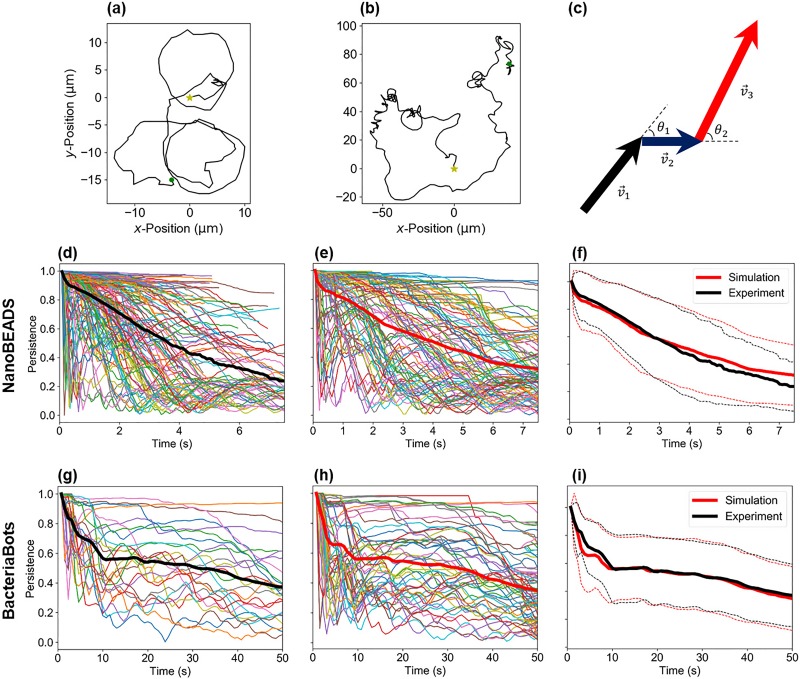
The data-based statistical motility model accurately recapitulates NanoBEADS and BacteriaBots swimming behavior. Representative trajectories for a NanoBEADS agent (a) and a BacteriaBot (b) produced from the experimental data (yellow stars represent the starting position while green dots represent the final position of the tracked agents), (c) a schematic of the successive agent position vectors and orientation change, persistence as a function of time for each tracked (d) and simulated (e) NanoBEADS agent, (f) persistence vs time averaged over tracked and simulated NanoBEADS agents, persistence vs time for each tracked (g) and simulated (h) BacteriaBot agent, and (i) persistence vs time averaged over tracked and simulated BacteriaBots agents. A total of 154 NanoBEADS and 26 BacteriaBots agents were tracked from experiments, and all tracked data were collected in isotropic chemical environments. Thick red and black curves in (d)–(i) indicate average persistence. The red and black dashed traces in (f) and (i) indicate ±standard deviation for simulated and experimental data, respectively.

