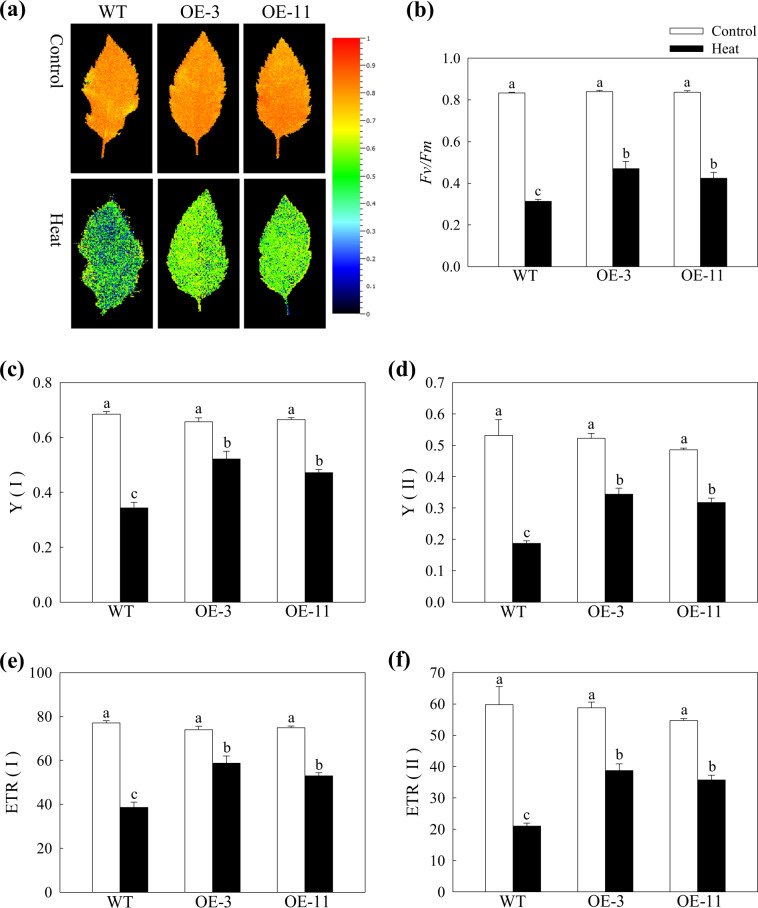
Fig. 5. The effect of heat stress on the activity of PSI and PSII in apple leaves.
a Chlorophyll fluorescence images and b Fv/Fm ratios of WT and transgenic plants at 25 °C or after 18 h of recovery after heat treatment. The colors in the images indicate Fv/Fm ratios ranging from 0 (black) to 1.0 (red). Changes in c the effective quantum yield of PSI [Y(I)] and d PSII [Y(II)] and e the electron transport rate of PSI [ETR (I)] and f PSII [ETR (II)]. Data are shown as the means of six replicates with SEs. Different letters indicate significant differences between treatments, according to one-way ANOVA and Tukey’s multiple range test (P < 0.05).

