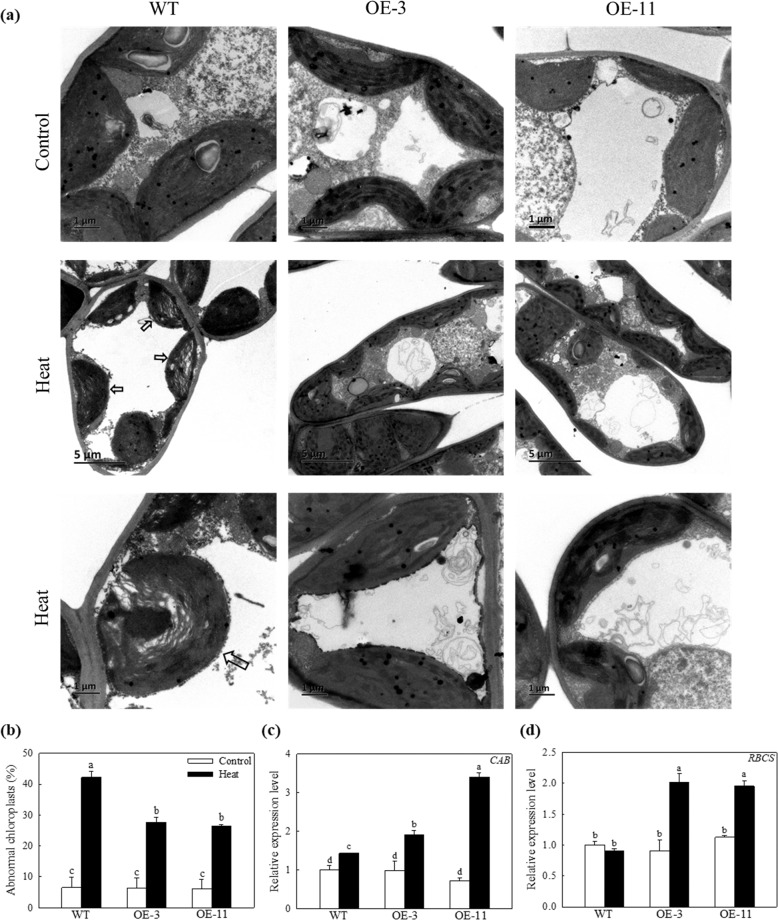
Fig. 6. The accumulation of abnormal chloroplasts in the cytoplasm of cells in the heat-exposed leaves of apple plants.
a TEM images of chloroplasts in mesophyll cells. Chloroplasts that exhibited disorganized thylakoid membranes are indicated by arrows. b The proportion of abnormal chloroplasts per cell from experiments described in a. Changes in the expression of c MdCAB and d MdRBCS under heat stress. Total RNA was isolated from leaf samples collected after 4 h of heat treatment. More than 10 cells were used to quantify chloroplasts. Data are shown as the means of six replicates with SEs. Different letters indicate significant differences between treatments, according to one-way ANOVA and Tukey’s multiple range test (P < 0.05).

