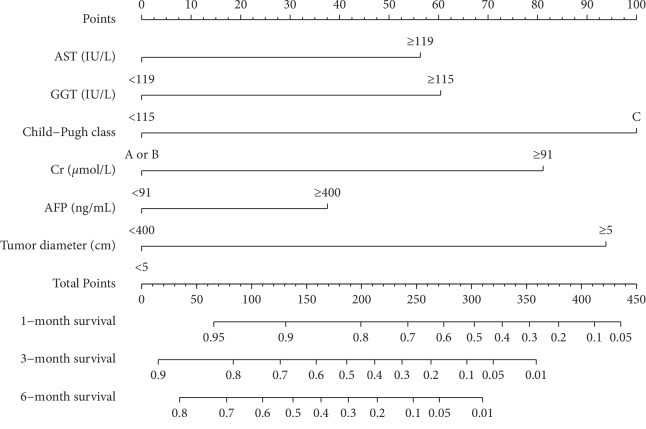
Figure 2.
Nomogram predicting 1-, 3-, and 6-month overall survivals of patients with HCC and PVTT on conservative treatment. The total points were obtained by adding the scores of each variable corresponding to the point on the upper pointing axis. A line was then drawn to the probability axis of the graph at the bottom, which indicated the survival probability at 1-, 3, and 6 months.

