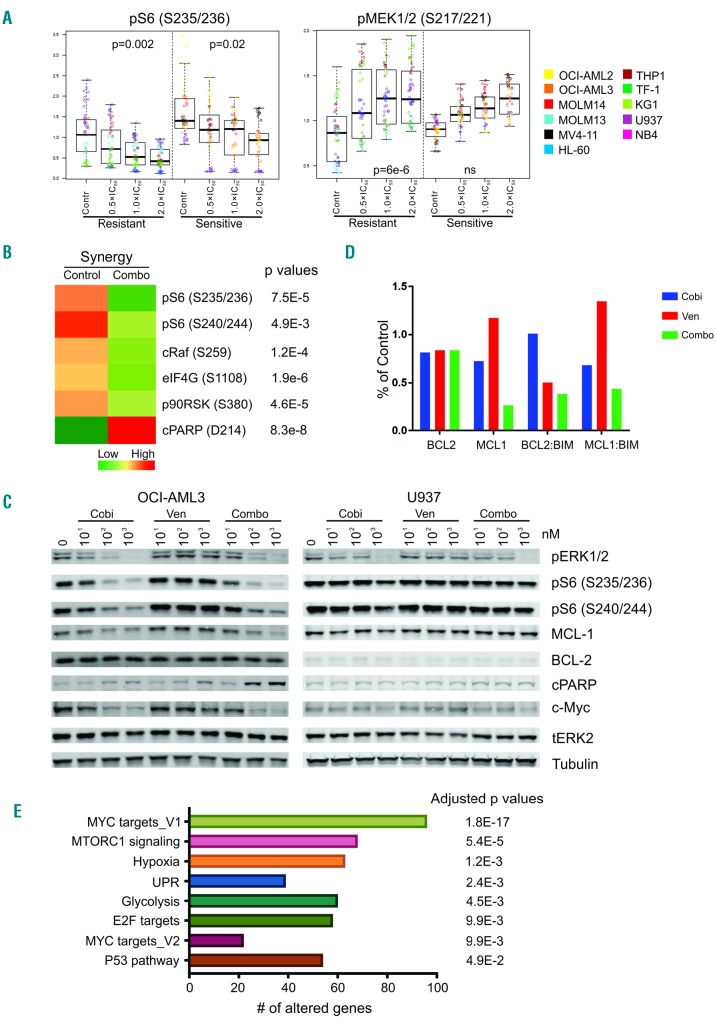
Figure 3.
Pharmacodynamic markers of drug response identified through reverse-phase protein arrays and RNA sequencing. Acute myeloid leukemia (AML) cell lines were left untreated or treated with cobimetinib or venetoclax as single agents or in combination at 0.5, 1, or 2 times the median inhibitory concentration (IC50) value of each compound in each cell line for 24 h. Cell pellets were harvested after treatment and subjected to reverse-phase protein array (RPPA) analysis as previously reported. (A) Plots depict proteins differentially expressed between cobimetinib-sensitive and cobimetinib-resistant cells. (B) The mean values of corresponding proteins in cell lines showing synergy to the combination treatment (CI<0.8 as presented in Table 1) are shown in the heatmap. Only the proteins showing significant differences (P<0.05) between control and treated groups are shown. C: untreated control; T: treated; S: sensitive; R: resistant; Syn: synergy. (C) Cells were treated with cobimetinib (Cobi), venetoclax (Ven), or a combination (Combo) at 10, 100 and 1000 nM for 4 h and subjected to lysis; proteins were separated and probed with the antibodies indicated. (D) AML cell lines were left untreated (control) or treated with cobimetinib or venetoclax as single agents or in combination at 10 times the median inhibitory concentration (IC50) value of each compound in each cell line for 4 h. Cell pellets were harvested after treatment and subjected to electrochemiluminescent enzyme-linked immunosorbent assay. The levels of BCL2, MCL1, BCL2:BIM and MCL1:BIM complexes were plotted based on percentages of the levels in the control group. (E) AML cells were treated and processed as described above for the RPPA assay. RNA was isolated using the RNeasy kit and sent for mRNA sequencing. The enriched pathways in cell types showing synergy in response to the combination are shown.

