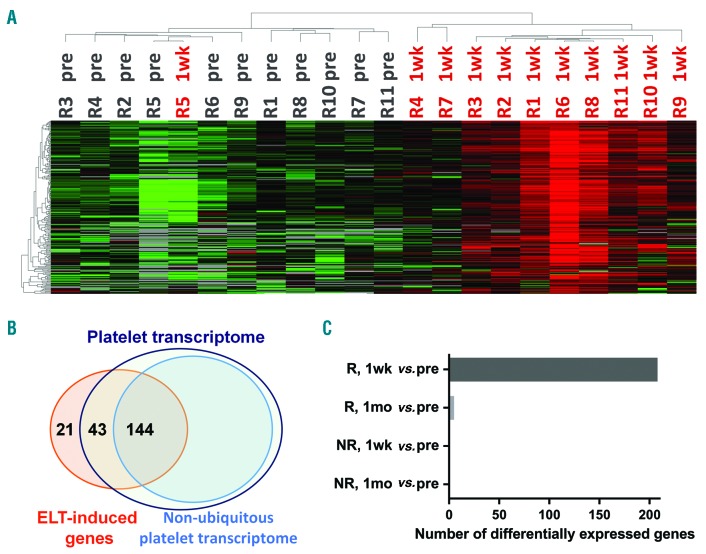
Figure 1.
Profiles of eltrombopag (ELT)-induced genes. (A) Heat map of ELT-induced genes at pretreatment (pre) and 1-week (1wk) time points in responders (R) with unsupervised clustering. Red to green colors represent relative high to low expression levels of individual genes; gray indicates below detection level. (B) Venn diagram of over-lapping genes between ELT-induced genes obtained in this study and published platelet transcriptome.12 (C) Numbers of differentially expressed genes between various samples. NR: non-responders; 1mo: 1-month.

