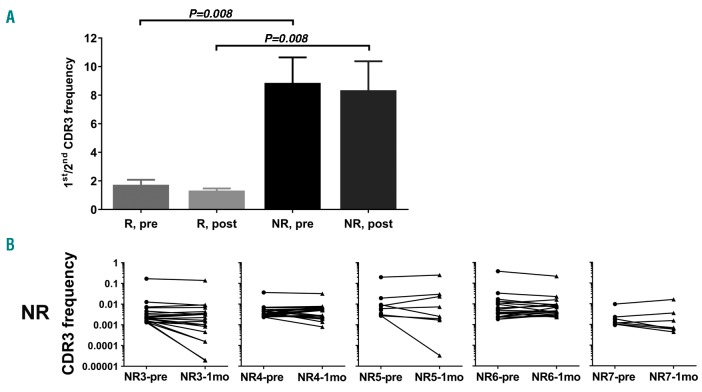
Figure 3.
Clonal TRB and non-response to eltrombopag (ELT). (A) Comparison of ratios of the 1st/2nd TRB CDR3 frequencies in responders (R) and non-responders (NR) at pretreatment (pre) and post-treatment (post) time points. Mean and standard error were plotted. Statistical difference was assessed by Mann-Whitney U test. (B) Frequencies of the top 20 TRB CDR3 clonotypes of individual non-responders (NR). Frequencies of the same clone were linked to show how these changed. 1mo: 1-month.

