Figure 3.
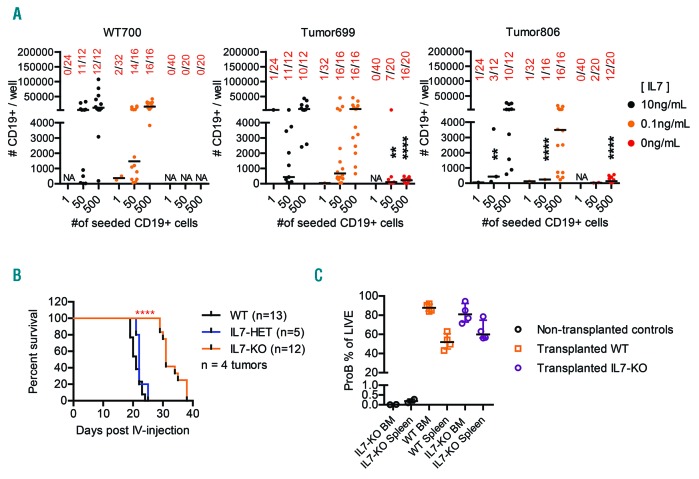
Interleukin-7 deficiency in BM microenvironment impedes progression of B-ALL progression in vivo. (A) Graphs displaying the result of a 10 day in vitro OP9 stroma co-culture of sorted bone marrow Pro-B (LIN-CD19+IgM–IgDCD43+KIT+) from one Wt (700) and two leukemic (699, 806) mice. The numbers on the x-axis are the number of pro-B cells initially sorted per well, while the numbers on y-axis are the total number of CD19+ cells present in the well at the time of analysis, based on counted events by flow cytometry during a fixed time of sample acquisition. The numbers in red are the number of positive wells/total number of seeded wells. The colors of the data dots indicate the concentration of IL7 during cultivation. (B) Kaplan-Meier curves describing the survival of 12-16 weeks old Wt (black line) and IL7-deficient (orange line) mice after intravenous injection with 100,000 sorted pro-B cells from lymph nodes of leukemic Pax5+/−Ebf1+/− mice. A drop in the curve represents euthanasia due to clinical manifestation of leukemia (palpable accessory axillary or subiliac lymph nodes). The overall log-rank (Mantel-Cox test) P value was calculated in GraphPad Prism, P****≤0.0001. The data is the result of a total of three separate experiments, using four different tumors (292, 1103, 697, 686). Each tumor was transplanted to both Wt and IL7-deficient recipients in the same experiment, Wt n=13, IL7−/− n=12. C). Graph showing the percentrage of Pro-B cells of total live cells in the bone marrow and spleen, of Wt and IL7−/− mice at the time of euthanasia.

