Figure 2.
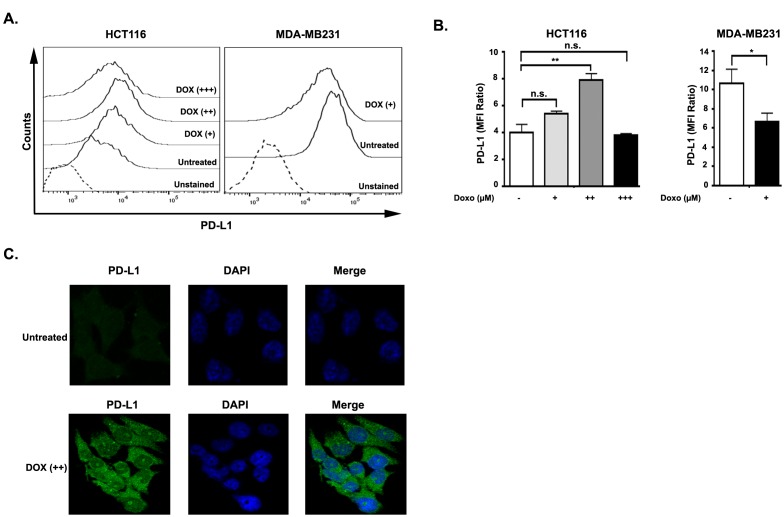
PD-L1 surface expression was regulated conversely in HCT116 and MDA-MB-231 cells by doxorubicin treatment. A) Representative histogram of surface expression of PD-L1 on HCT116 and MDA-MB-231 cells after treatment with different concentrations of DOX (for HCT116 cells (+) 0.1 ?M, (++) 0.5 ?M, (+++) 1.5 ?M; for MDA-MB-231 cells (+) 0.7 ?M) for 18 h. B) Flow cytometric measurement of three independent experiments are represented as MFI ratio = (MFIPD-L1/MFIunstained) SEM. Significance was calculated using one-way analysis of variance (ANOVA). P-values are as follows: *P < 0.05; **P < 0.01. C) Representative immunofluorescence image of HCT116 cells after 0.5 ?M DOX treatment or kept untreated for 18 h. Anti-PD-L1 antibody is used to stain PD-L1 (green) and DAPI (blue) is used to stain nucleus.

