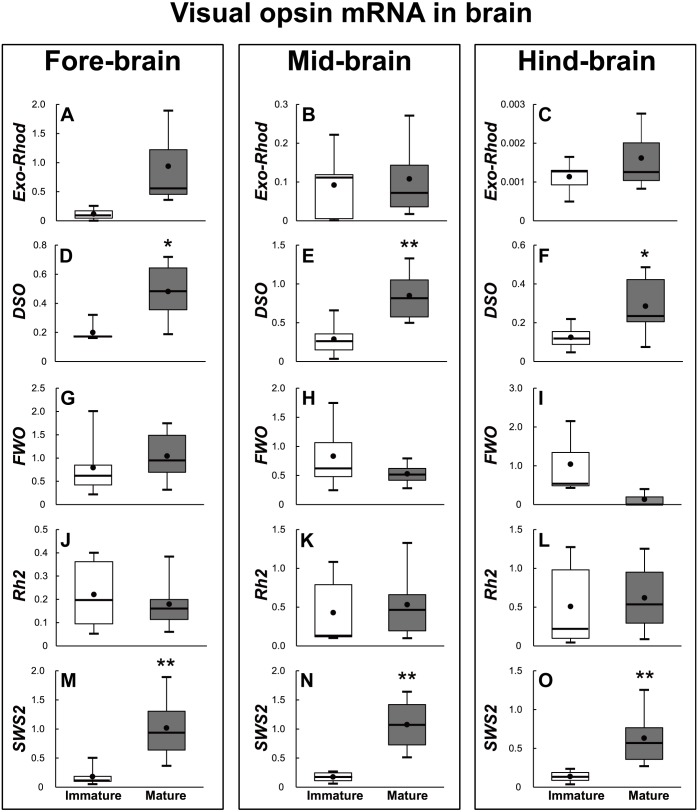
Figure 7. Visual opsin mRNA level in the brain of sexually immature and mature male Japanese eel.
For the artificially induced sexual maturation, hCG was intraperitoneally injected to the experimental fish group (n = 6) at a concentration of 1 IU/g body weight. Immature fish was sampled before hCG injection (n = 6). Eight weeks after injection, brain was sampled and used for total RNA extraction and cDNA synthesis. The mRNA expression of visual opsin (A–O) in each sample was measured real-time qPCR. Boxplots show min and max values (whiskers), first and third quartiles (box limits), and median (box inner line) of mRNA levels. The asterisk above each bar indicates significant differences according to the unpaited t test (*P < 0.05, **P < 0.01).

