Fig. 1.

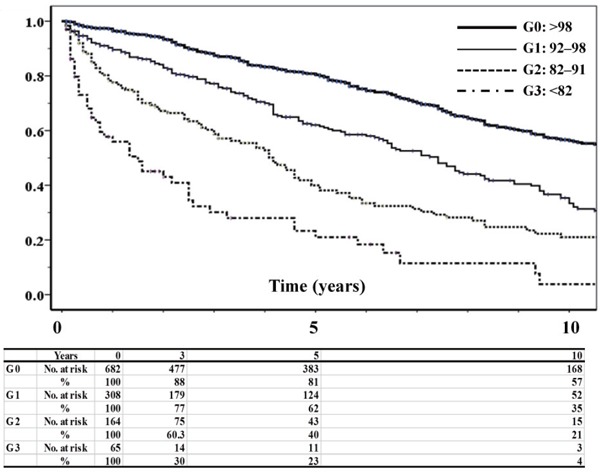
Kaplan–Meier estimates of OS according to the GNRI. There were significant differences among each GNRI level (all p < 0.001).

Kaplan–Meier estimates of OS according to the GNRI. There were significant differences among each GNRI level (all p < 0.001).