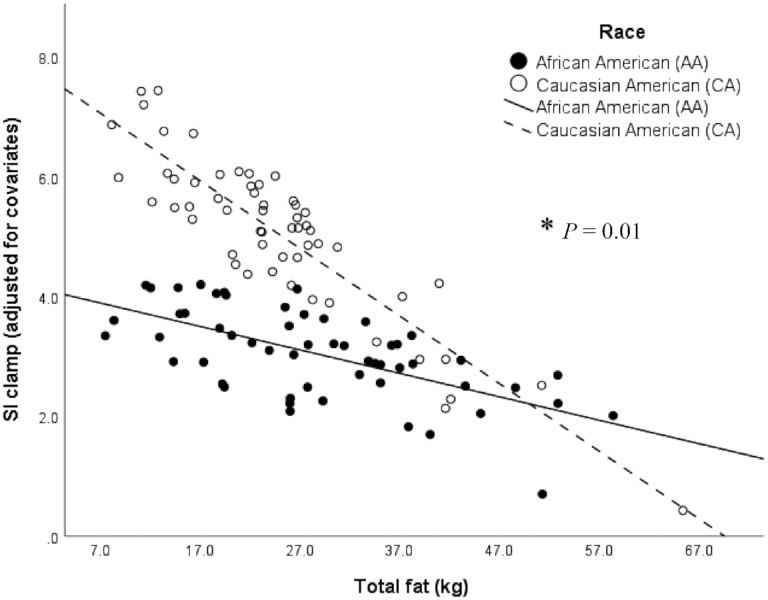
FIGURE 2.

Relation between skeletal muscle insulin sensitivity (SI Clamp 10−4.dL.kg−1.min−1/[μU/mL]) assessed by the hyperinsulinemic-euglycemic clamp, and total fat mass (kg) measured by DXA, on the basis of a multiple linear regression model (n = 112) adjusted for the covariates sex, age, and total lean mass in African Americans (n = 55; black dots and line) and Caucasian Americans (n = 57; white dots and dashed line). *P = 0.01 significant race × total fat interaction, P < 0.01 (overall model), R2 = 50%. A higher total fat mass was more strongly associated with a lower SIClamp in Caucasian Americans (β = −0.15, SE = 0.03, P < 0.001, R2 = 43%) than in African Americans (β = −0.04, SE = 0.02, P = 0.03, R2 = 28%).
