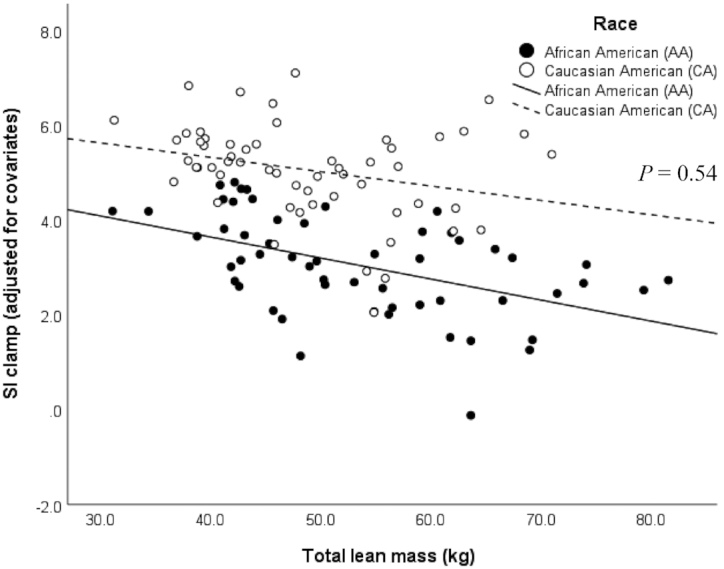
FIGURE 6.

Relation between skeletal muscle insulin sensitivity (SIClamp 10−4.dL.kg−1.min−1/[μU/mL]) assessed by the hyperinsulinemic-euglycemic clamp, and total lean mass (kg) measured by DXA, on the basis of a multiple linear regression model (n = 112) adjusted for the covariates sex, age, and total fat mass in African Americans (n = 55; black dots and line) and Caucasian Americans (n = 57; white dots and dashed line). P = 0.54 (race × total lean mass interaction), P < 0.01 (overall model), R2 = 47%.
