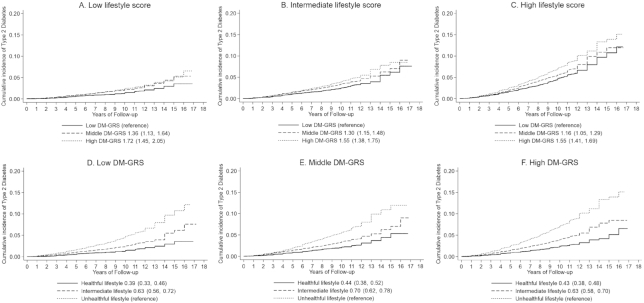
FIGURE 2.
Adjusted type 2 diabetes events rates, stratified by lifestyle score (A–C) and DM-GRS (D–F), of participants in the pooled cohort. The 95% CIs for the HRs are provided in parentheses. The participants in the 2 cohorts were pooled by tertile of lifestyle score or genetic risk within each cohort. Cox regression models were adjusted for age, sex, region, and data source, which was performed on cohort-specific population averages for each covariate. DM-GRS, diabetes genetic risk score.

