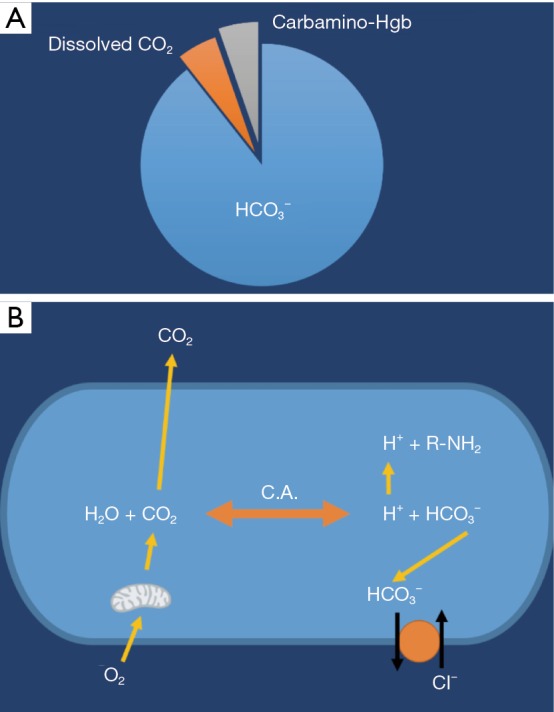
Figure 4.

Schematic figure of carbon dioxide transport and metabolism. (A) Schematic illustrating the relative fraction of each of the components of carbon dioxide transport in the blood; (B) schematic illustrating carbon dioxide metabolism and transport in a cell (C.A. is carbon anhydrase).
