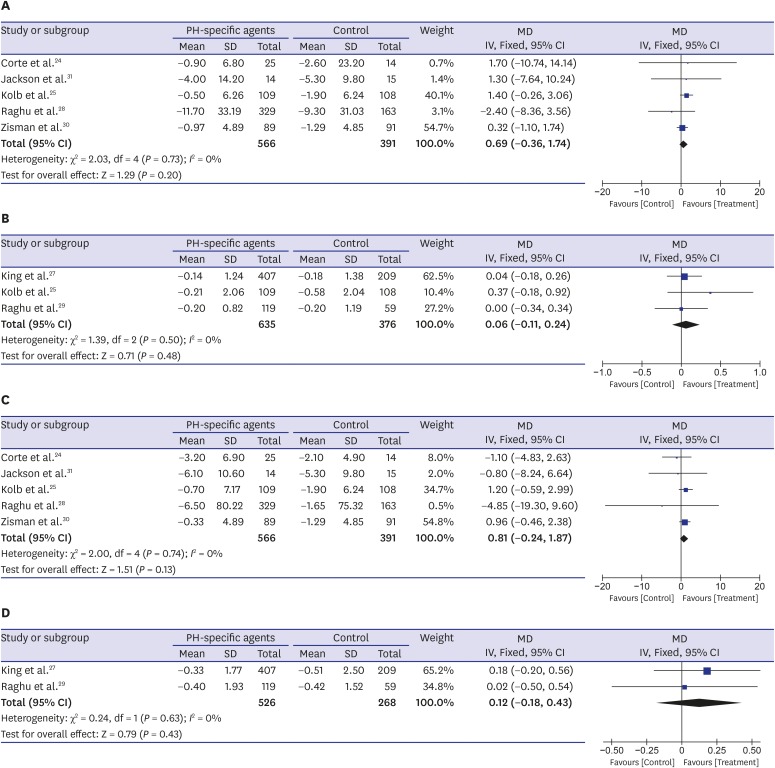
Fig. 3. Pooled effects of PH-specific agents versus controls on changes of lung function; (A) FVC % predicted, (B) FVC L, (C) DLco %, and (D) DLco mmol·kPa−1·min−1.
DLco = diffusion capacity of the lung for carbon monoxide, FVC = forced vital capacity, PH = pulmonary hypertension, MD = mean difference, SD = standard deviation, CI = confidence interval.

