
Figure 5.
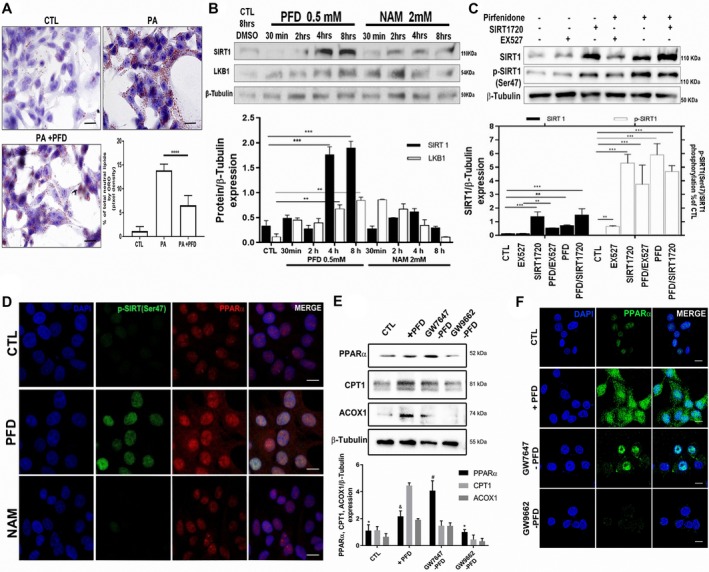
PR‐PFD induces PPAR‐α signaling and SIRT1 both in vivo and in vitro. (A) Representative microphotographs and analysis of Oil Red O staining of HepG2 cells incubated with 1‐mM palmitate with or without PFD. Scale bars = 20 μm. (B) In HepG2 cells, SIRT1 and LKB1 are overexpressed after 4 and 8 hours of PFD incubation, whereas NAM kept the expression down‐regulated. (C) PFD increases SIRT1 expression to similar levels than those obtained with SIRT1720 activator, whereas EX527 as a specific SIRT1 inhibitor decreased SIRT1; diminished SIRT1 phosphorylation in Ser47 is also shown. (D) Positive co‐localization in nuclei of phosphorylated SIRT1(Ser47) and PPAR‐α is observed in cells incubated with PFD. (E) Effect of PPAR‐α agonist (GW7647) and antagonist (GW9662) on HepG2 cell protein expression. (F) Representative confocal images. Scale bars = 10 µm. Data are expressed as the median of the group ± SEM. Abbreviations: CTL, control; PA, palmitate.