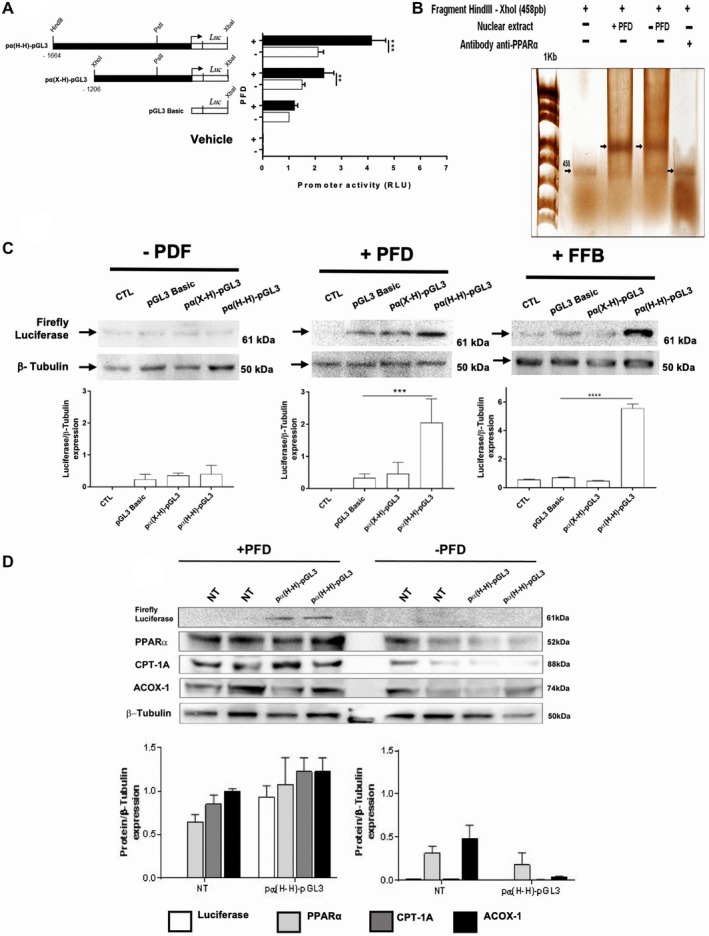
Figure 7.

PFD induces activation of PPAR‐α promoter and expression in vitro of PPAR‐α, CPT1, and ACOX1. (A) Schematic representation of human PPAR‐α promoter constructs transfected in HepG2 cells and subsequently treated with PFD or 0.1% DMSO (−PDF). Luciferase expression was quantified using a luminometer. (B) Silver‐stained EMSA. (C) Western blots for quantification of luciferase expression. FFB was used as positive control. (D) PPAR‐α, CPT1, and ACOX1 protein expression in HepG2 cells. Values represent the mean ± SD. ****P < 0.0001 and ***P < 0.001. Abbreviations: CTL, control; NT, Non Treated cells.
