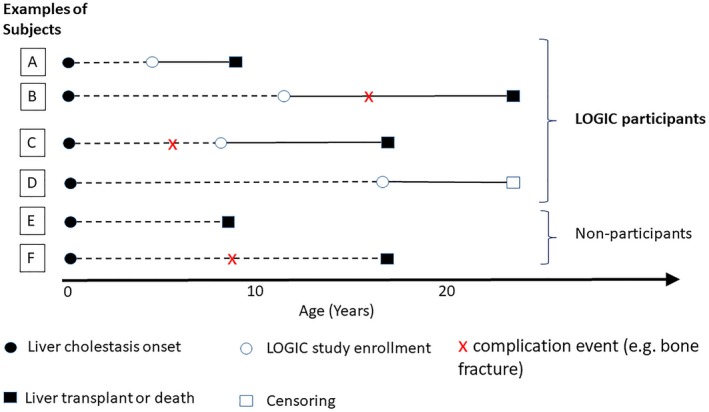
Figure 1.

Schematic to represent study design. This schematic illustrates the time of study entry, time to complication event, time to liver transplant or death, and the censoring of six classes of example subjects. The solid black dot represents the onset of cholestasis. The horizontal dotted lines indicate the time period prior to study entry. The white circle represents the time of study enrollment. The red “x” represents the time of complication event (e.g., bone fracture). The black and white squares represent the time of liver transplant/death and censoring, respectively. Although example participants A, B, C, and D were enrolled and observed in the LOGIC study at various time points after birth, the subjects in groups E and F experienced liver transplant/death before the opportunity to be enrolled, and therefore were not observed in the study. In addition, not all events were observed in A, B, C, and D due to right censoring and left censoring. For example, the event time of complication was censored by liver transplant/death for participant A. Participant B experienced the complication event before liver transplant/death. Subject C experienced the complication event before being enrolled, and the time of the complication event was retrospectively collected. For subject D, the complication did not happen before he or she was censored (dropped out of the LOGIC study or the data were cut off to retrieve the analysis data set). Abbreviation: LOGIC, Longitudinal Study of Genetic Causes of Intrahepatic Cholestasis.
