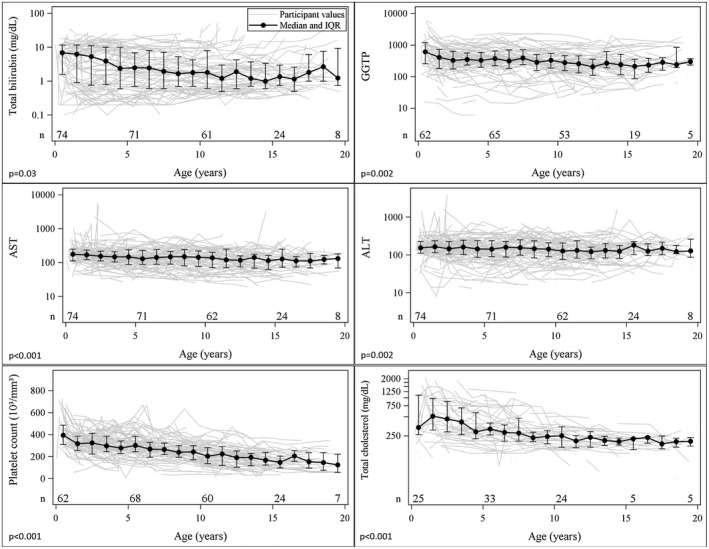
Figure 2.

Laboratory characteristics among survivors by age. Individual participant laboratory values are shown over time with the median and interquartile range shown in blue and P values. The P values are from tests for trends in laboratory values by age in generalized estimating equation models accounting for correlation among repeated measures within participants. Serum bilirubin, cholesterol, and GGT are higher earlier in life but improve in many children. The platelet count progressively falls over childhood. Due to sparse data after age 20 years, only laboratory values measured at age 20 or younger are presented. Abbreviations: GGTP, gamma‐glutamyl transpeptidase; and IQR, interquartile range.
