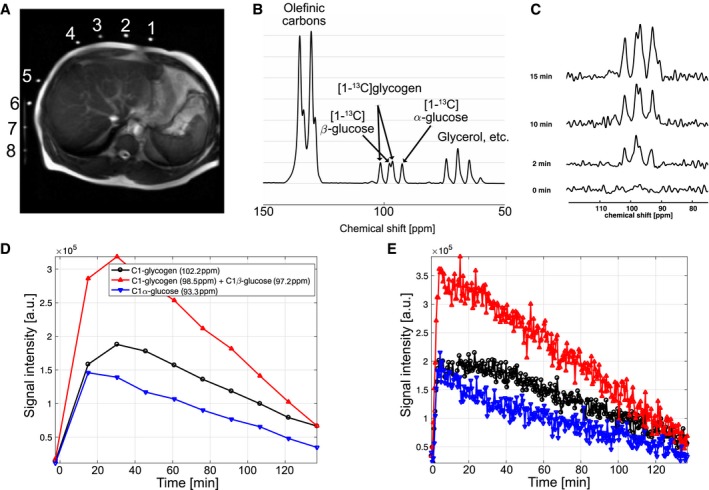
Figure 2.

Real‐time hepatic glycogen synthesis of a representative subject (participant 1), measured by dynamic 13C MRS followed by oral administration of [1‐13C]‐glucose. (A) Axial 1H MRI showing the position of 13C paddle receive‐array coils relative to the liver. Scale = 32 cm by 32 cm. (B) The first 15‐minute averaged spectrum following glucose administration and (C) 30‐second averaged spectra at 0‐, 2‐, 10‐, and 15‐minute time frames showed that glucose and glycogen started to build up rapidly. [1‐13C]‐labeled glycogen (98.5 and 102.2 ppm) as well as α‐glucose (93.3 ppm) and β‐glucose (97.2 ppm) could be resolved in each spectrum. Kinetics of [1‐13C] α‐glucose and β‐glucose and [1‐13C] glycogen in temporal resolutions of (D) 15 minutes and (E) 30 seconds. Abbreviation: a.u., arbitrary unit.
