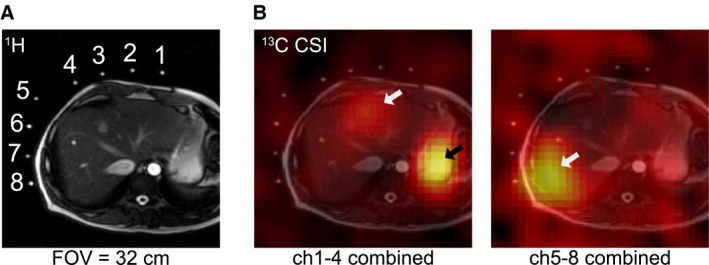
Figure 3.

Spatial distribution of 13C signal after oral administration of [1‐13C]‐glucose (participant 2). (A) Axial 1H MRI image that shows relative positions of the 13C paddle receive array coils and the slice prescription for 13C CSI. Fiducial markers indicate the location of each channel of the paddle coils. (B) Spatial distribution of the 13C metabolites at 90‐110 ppm. The metabolite maps are overlaid over the 1H MRI. [1‐13C]‐glucose and [1‐13C]‐glycogen signals are mainly detected from where stomach (black arrow) and liver (white arrows) are located. Signals from the stomach area were dominant in channels #1‐4 (B, left), whereas channels #5‐8 (B, right) primarily detected signals from the liver. All images scale = 32 cm by 32 cm. Abbreviation: ch, channel.
