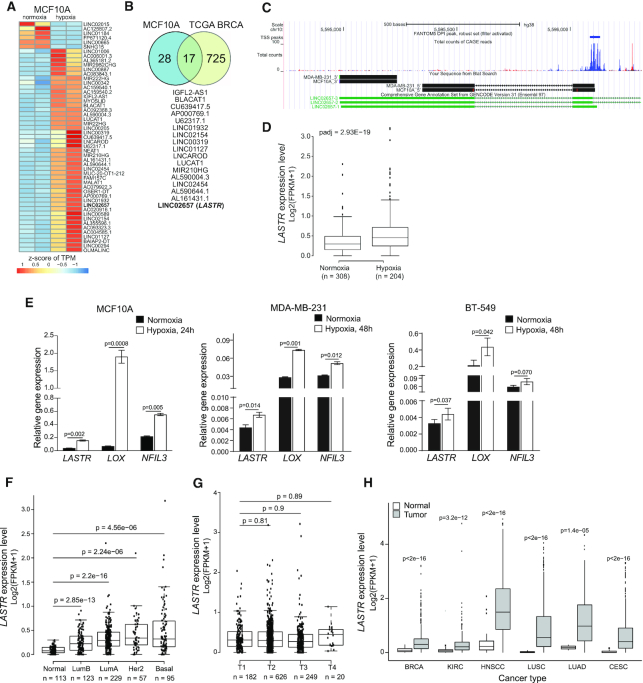
Figure 1.
The lncRNA LASTR is commonly upregulated in epithelial cancers. (A) Heatmap showing differentially expressed lncRNAs in normoxic and hypoxic (1% O2, 48 h) MCF10A cells as determined by RNA-seq. The scale bar indicates the z-score of transcripts per million (TPM). (B) Overlap between hypoxia-associated lncRNAs in hypoxic TCGA BRCA tumors and hypoxic MCF10A cells. (C) Graphical representation of the zoomed LASTR genomic region along with LASTR CAGE expression data of the LASTR-1 isoform obtained from the FANTOM5 project and the results from a 5′ and 3′ RACE analysis in MCF10A and MDA-MB-231 cells. (D) Boxplot showing LASTR expression in the TCGA BRCA patients stratified by hypoxia status as described in (19). n = number of patients. (E) RT-qPCR analysis of mRNA expression analysis in breast cells cultured under normoxic and hypoxic (1% O2) conditions. Data are presented as mean ± s.e.m.; P-values were determined by two-sided t-tests, n = 3. (F) LASTR expression in the TCGA BRCA patients stratified according to their PAM50 status. P‐values were determined by a two‐sided t‐test. n = number of patients. (G) LASTR expression in the TCGA BRCA patients stratified by tumor stages (T1–T4). n = number of patients. (H) LASTR expression in the TCGA tumor samples. Kidney Renal Clear Cell Carcinoma (KIRC), Head and Neck Squamous Cell Carcinoma (HNSC), Lung Squamous Cell Carcinoma (LUSC), Lung Adenocarcinoma (LUAD) and Cervical Squamous Cell Carcinoma and Endocervical Adenocarcinoma (CESC). P‐values were determined by two‐sided t‐tests. (D, F, G, H) Boxplots show the 25th and 75th percentile of values. The horizontal line indicates the median expression value with whiskers expanding to 1.5 times the interquartile range of the data. P‐values were determined by two‐sided t‐tests.

