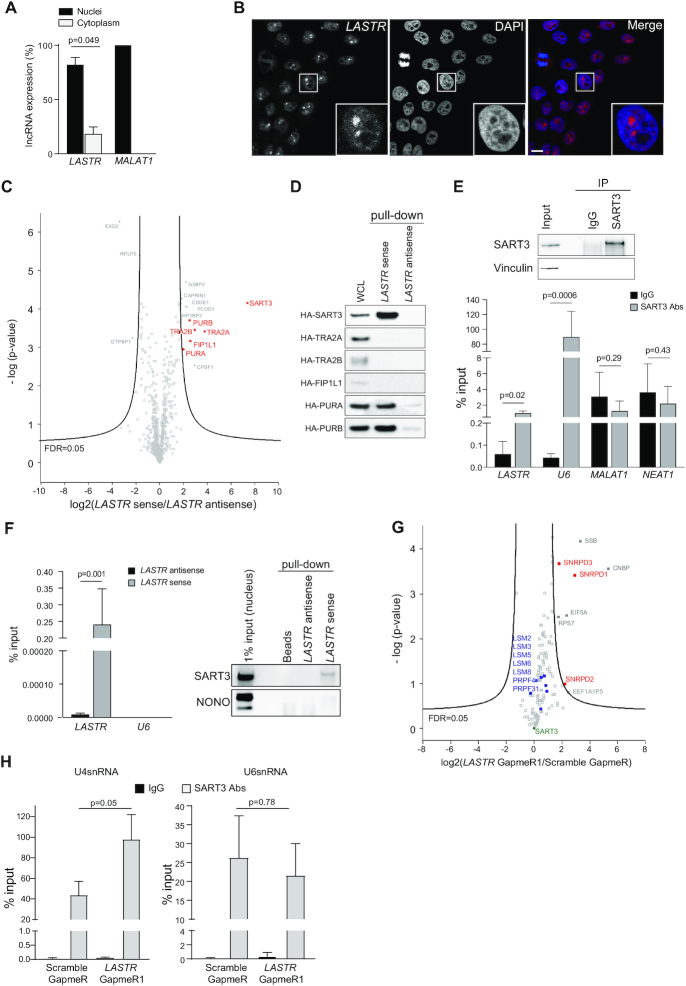
Figure 3.
LASTR modulates SART3 interactions with U4snRNP and U6snRNP. (A) Subcellular localization of LASTR. LASTR expression was analyzed by RT-qPCR in cellular fractions of MCF10A. Data are presented as mean ± s.e.m.; P-values were determined by two-tailed t-tests, n = 3. (B) LASTR fluorescent in situ hybridization of MCF10A. LASTR-specific probe signals are shown in red. Scale bar, 10 μm. (C) Volcano plot showing LASTR interactors from triplicate pull-downs of total protein extracts from MCF10A cells. Proteins interacting with biotinylated LASTR sense or antisense strands were determined by MS. Putative nuclear interactors of LASTR are shown in red. (D) Validation of LASTR nuclear interactors. Biotinylated sense or antisense LASTR was used for pull-down from MCF10A cells ectopically expressing HA-tagged candidate proteins. The pulldown was followed by immunoblotting using anti-HA antibody. (E) SART3 was immunoprecipitated from MCF10A total protein extracts using anti-SART3 antibody. The presence of SART3 in the immunoprecipitate was detected by immunoblotting, the presence of the indicated non-coding RNAs in the SART3 immunoprecipitate was determined by RT-qPCR analysis. Data are presented as mean ± s.e.m.; P-values were determined by two-tailed t-test, n = 3. (F) LASTR was pulled down from MCF10A cell lysates using biotinylated Stellaris probes. Stellaris probes against antisense LASTR were used as a negative control. SART3 and NONO were detected in the LASTR pull-downs by immunoblotting. (G) Volcano plot of SART3 interactors from triplicate pull-downs of total protein extracts from MCF10A cells treated with Scramble GapmeR or LASTR GapmeR1. U4-associated proteins are shown in red; U6-associated proteins are shown in blue. (H) Presence of U4snRNA and U6snRNA in SART3 immunoprecipitates as detected by RT-qPCR. SART3 immunoprecipitated from total protein extracts of MCF10A cells treated with Scramble GapmeR or LASTR GapmeR1 using anti-SART3 antibody. Data are presented as mean ± s.e.m.; P-values were determined by two-tailed t-tests, n = 3.

