Figure 6.
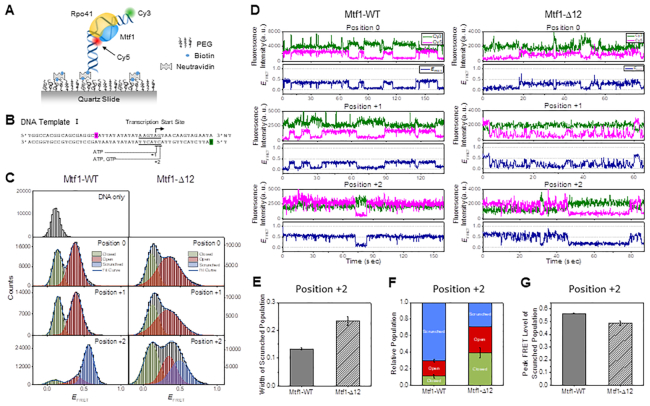
Single-molecule FRET time traces measure the dynamics of open and initiation complexes of Mtf1-WT and Mtf1-Δ12. (A) Schematic representation of the single-molecule set up to measure the dynamics of the transcription initiation reaction. Dual-labeled promoter DNA in complex with Rpo41 and Mtf1 is observed under a total internal reflection fluorescence microscope. (B) The sequence of the DNA template used in single-molecule FRET measurements. Dye labeling positions are highlighted in magenta (Cy5) and green (Cy3). Consensus nonanucleotide promoter sequence is underlined, and the transcription start site is marked with an arrow. The initiation complex can be stalled at +1 or +2 position by supplying 0.5 mM ATP or ATP + GTP. (C) FRET histograms from single-molecule FRET time traces with co-localized Cy3 and Cy5 signals at each stalling position for Mtf1-WT and Mtf1-Δ12. Histograms were fit to two or three Gaussian peaks. Green, red, and blue curves represent closed, open, and scrunched populations, respectively. (D) Representative single-molecule FRET time traces at positions 0, +1 and +2, shown for Mtf1-WT and Mtf1-Δ12. Cy3 (green) and Cy5 (magenta) signals and calculated FRET efficiency (navy) are shown. (E) Gaussian width of the scrunched population at position +2, compared between Mtf1-WT and Mtf1-Δ12. (F) The relative population of closed, open, and scrunched conformations at position +2, compared between Mtf1-WT and Mtf1-Δ12. (G) Mean FRET level of the scrunched population at position +2, compared between Mtf1-WT and Mtf1-Δ12.

