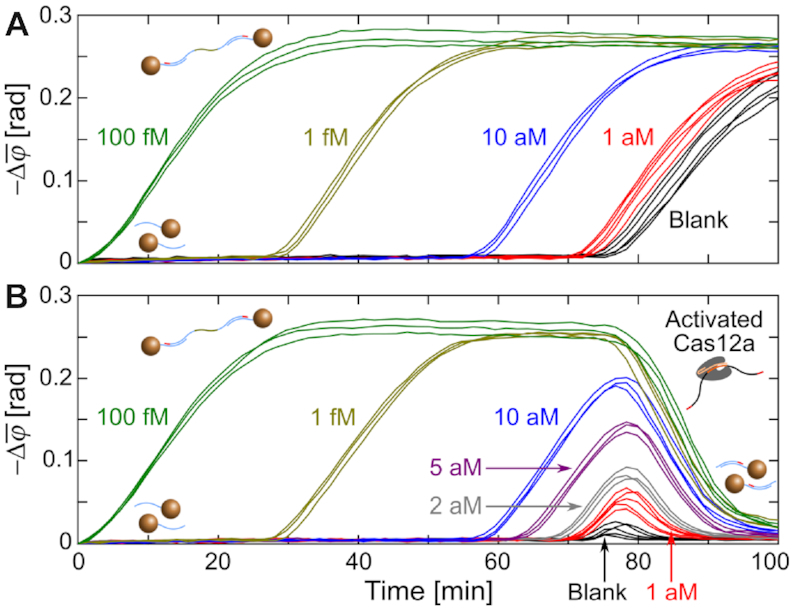
Figure 4.

Real-time changes of  (1–10 Hz) for the indicated target concentrations amplified by PG-RCA (A) without and (B) with CIRI. Independent replicates (n = 5 for 1 aM targets and blank controls, n = 3 for other target concentrations) are plotted in the same color. Black curves in Figures 3A and 4A are based on the same data.
