
Figure 5.
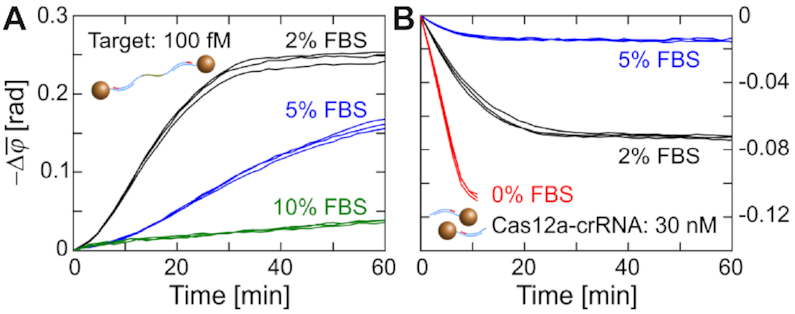
Performance of PG-RCA and CIRI in diluted FBS samples. Real-time changes of  (1–10 Hz) are recorded for (A) PG-RCA of 100 fM target DNA and (B) cleavage of MNP clusters by preformed Cas12a ternary complexes. Final concentrations of FBS are indicated in panels. Independent replicates (n = 3) are plotted in the same color. Red curves in panel (B) are from Figure 2B for reference.