Figure 2.
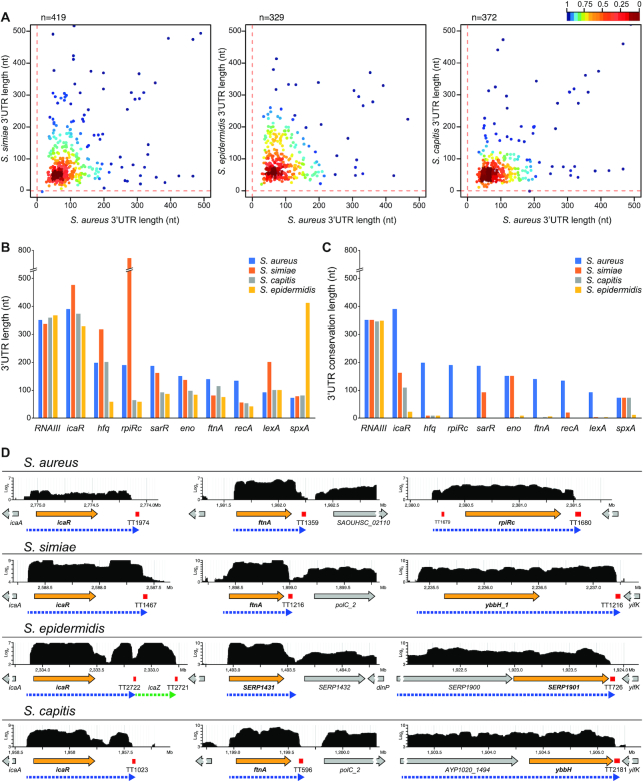
The lengths of the 3′UTRs do not correlate among staphylococcal species. (A) Scatter plots representing the real 3′UTR lengths of each staphylococcal species in function of the 3′UTR lengths of the corresponding orthologous S. aureus mRNAs. The length of the 3′UTRs from S. aureus orthologous monocistronic mRNAs were annotated by combining the transcriptomic data and the prediction of Rho-independent transcriptional terminators by TransTermHP (32). Only 3′UTRs shorter than 500 nt are represented. The plot was coloured by applying the Kernel density estimation, which indicates the proximity of the dots: blue, isolated dots; red, overlapping dots. (B) Plot representing the 3′UTR length of relevant orthologous genes in the indicated staphylococcal species. (C) Plot representing the 3′UTR conservation length of the orthologous genes analysed in B, which was determined by the blastn algorithm. RNAIII is included as an example of an mRNA with a highly conserved 3′UTR. (D) Browser images showing the RNA transcribed from the icaR, ftnA and rpiRc chromosomic regions of the S. aureus, S. simiae, S. epidermidis and S. capitis strains. The RNA-seq data was mapped to the corresponding genomes, and the transcriptomic maps were loaded onto a server based on Jbrowse (27). The complete transcriptomic maps are available at http://rnamaps.unavarra.es/.

