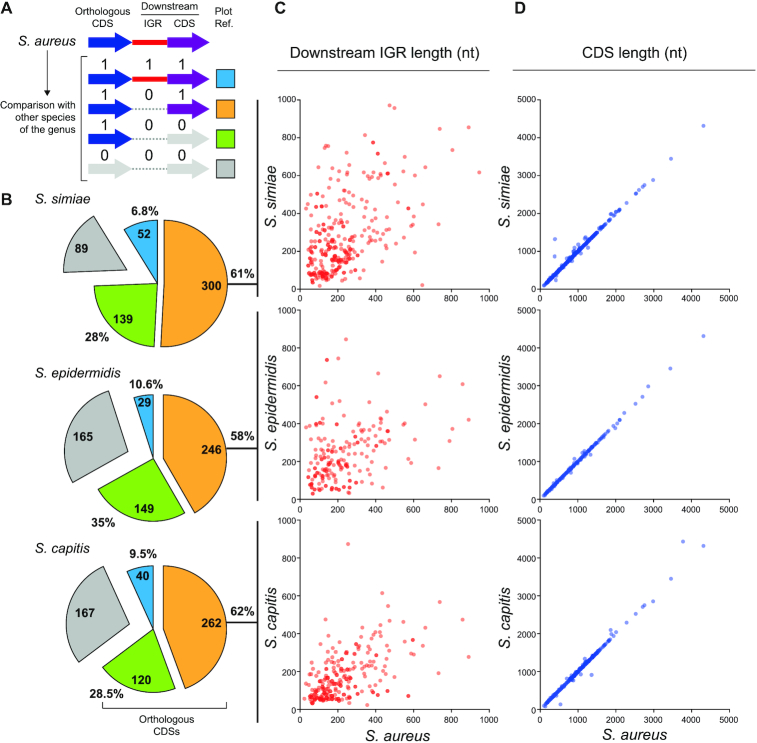
Figure 3.
Nucleotide sequence variation occurring downstream of orthologous CDSs may explain 3′UTR diversity. (A) Schematic representation of the conservation analysis performed on IGRs and CDSs located downstream of an orthologous CDS. Whole-genome comparisons between S. aureus and its phylogenetically-related species were performed using Mauve (49). Values 1 and 0 were assigned to conserved and non-conserved IGRs/CDSs, respectively, and a different colour was attributed depending on the conservation configuration. Blue: the IGR and CDS downstream of the orthologous CDS are conserved; orange: the downstream CDS is conserved but not the IGR; green: both downstream regions are not conserved, and grey: no orthologous CDS was found in the analysed species. (B) Pie chart quantifying the different categories represented in A. (C) Plot showing the length of the IGR downstream of each orthologous CDS in the different species compared to that of S. aureus. (D) Plot showing the length of the orthologous CDS in the different species compared to that of S. aureus. Note that only the IGRs and CDSs that fall under the orange category are plotted in C and D.

