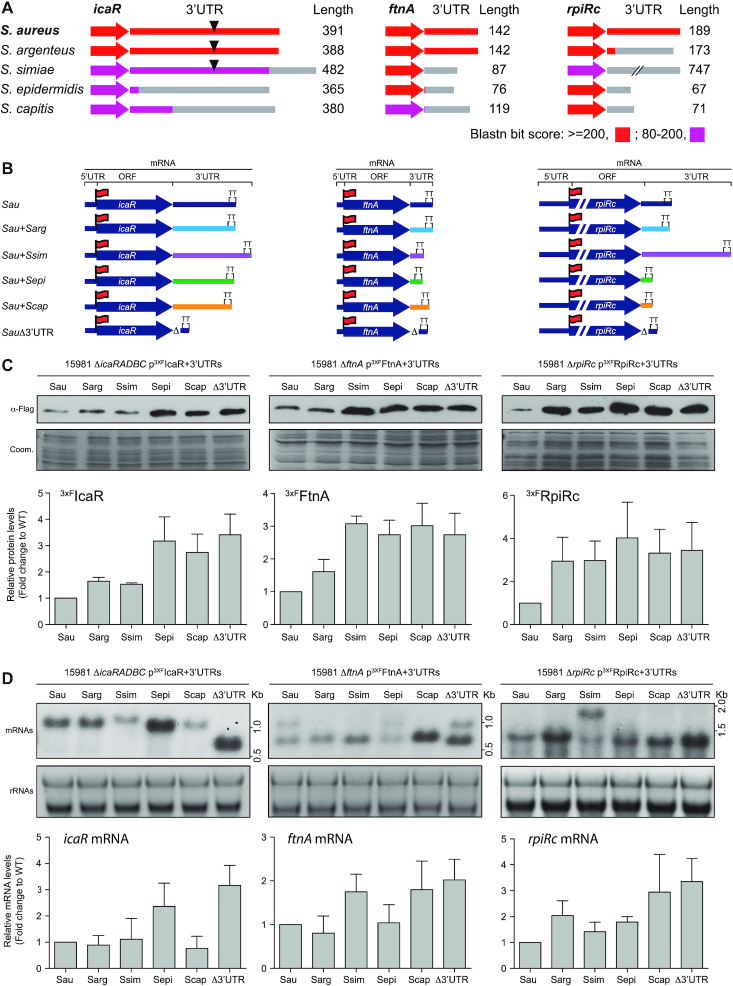
Figure 4.
Changes in 3′UTRs sequences affect protein expression. (A) Schematic representation of the conservation analysis of the icaR, ftnA and rpiRc mRNAs among phylogenetically-related species. The colour code indicates the blastn bit score. The 3′UTR lengths in the corresponding species are indicated and represented as grey lines. Black triangles indicate the presence of the UCCCC motif. (B) Schematic representation of the constructed chimeric mRNAs, which comprises the S. aureus CDS and a 3′UTR from a different staphylococcal species (for strains and plasmids details see supplementary data). Red flags indicate the insertion of the 3xFLAG tag in the N-terminus. (C) Western blot showing the levels of an orthologous protein when it is expressed from different chimeric mRNAs. The Western blot was developed using peroxidase conjugated anti-FLAG antibodies. A Coomassie stained gel portion is shown as a loading control. (D) Northern blot showing the mRNA levels expressed from the constructs represented in B. These were detected using CDS-specific antisense radiolabelled RNA probes. Ribosomal RNAs stained with Midori Green are shown as loading controls. Western and Northern blots images show the representative results from at least three independent replicates. Protein and mRNA levels were quantified by densitometry of Western blot images and Northern blot autoradiographies using ImageJ (http://rsbweb.nih.gov/ij/). Each of the protein or mRNA levels was normalized to the levels of S. aureus. Sau, S. aureus; Sarg, S.argenteus; Ssim,S. simiae; Sepi, S. epidermidis; Scap,S. capitis.

