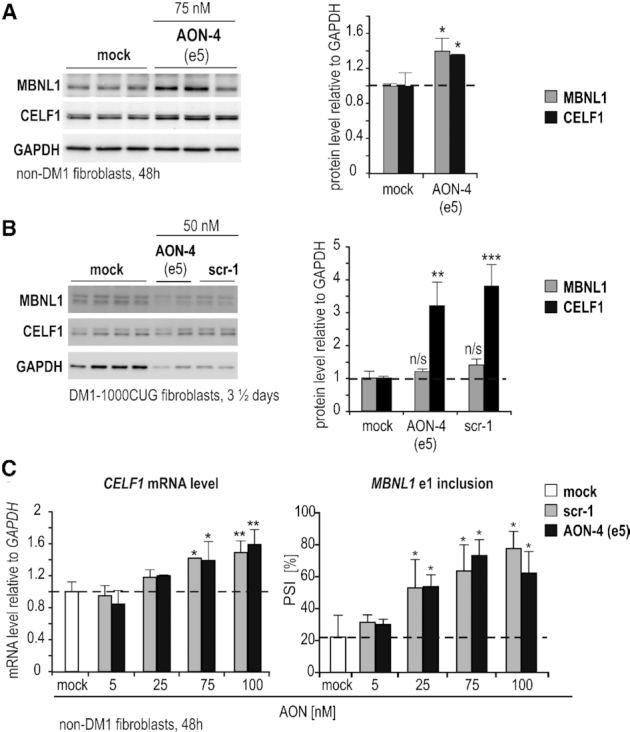
Figure 5.

2′-Ome-PS-induced splicing abnormalities correlate with aberrant expression and splicing of MBNL1 and CELF1. (A, B) Representative immunoblot analyses of MBNL1 and CELF1 protein level relative to GAPDH in DM1-unaffected (A) or DM1-1000CUG (B) fibroblasts transfected with indicated amounts of distinct 2′-Ome-PS AONs targeting DMPK e5. Mock (lipofectamine) and scrambled AON (scr-1) were used as controls. Each lane represents an individual sample. Quantitation is shown to the right. Horizontal dashed line marks the protein level in untreated controls. (C) RT-PCR quantitation of CELF1 total mRNA and the alternative splicing of MBNL1 e1 in non-DM1 fibroblasts transfected with indicated amounts of 2′-Ome-PS AONs. AON scr-1 was used as a control. Horizontal dashed lines mark the percentage of CELF1 level or MBNL1 e1 inclusion in mock samples, respectively. Statistical significance relative to mock is indicated.
